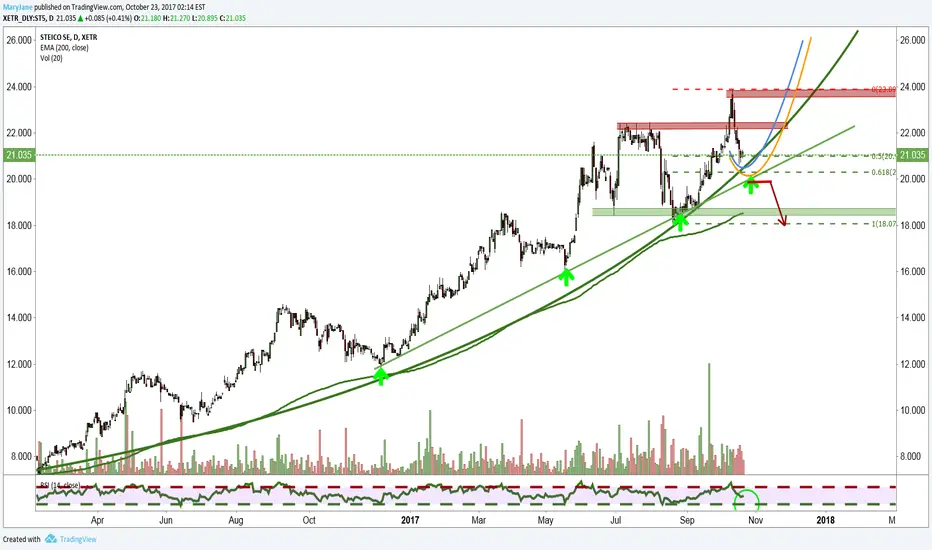
This is a nice bullish Chart. Last week wee have seen a breakout attempt. The breakoutmove was ~ 10%, but the retest ot the BO-Niveau wasn`t bought again..that`s weak. So in consequence the stack fell back below 22€.
At present we are trading near the uptrendline which is based near the 61,8- the max fibo. Will htat Level be bought, i exspect a cyclical buying wave upt to 22/24/26€ Trading below 19,9 means aiming 18€ (trendbreak).
The RSI has place to fall further, so a further downwave should be exspected before the trend can be played again.
Note
wow -faster than a speedy bullet! Note
will we totay take the 22,4-hurdle? here i exspect a direct buyingwave up to 24Note
the resists seems to be too strong.... Note
yihaaa Note
Note
Make or Break! Note
Note
YES - nice BO, now watch the RSI! A test of the BO-Niveau should be exspected soonNote
Note
YES! Disclaimer
The information and publications are not meant to be, and do not constitute, financial, investment, trading, or other types of advice or recommendations supplied or endorsed by TradingView. Read more in the Terms of Use.
Disclaimer
The information and publications are not meant to be, and do not constitute, financial, investment, trading, or other types of advice or recommendations supplied or endorsed by TradingView. Read more in the Terms of Use.