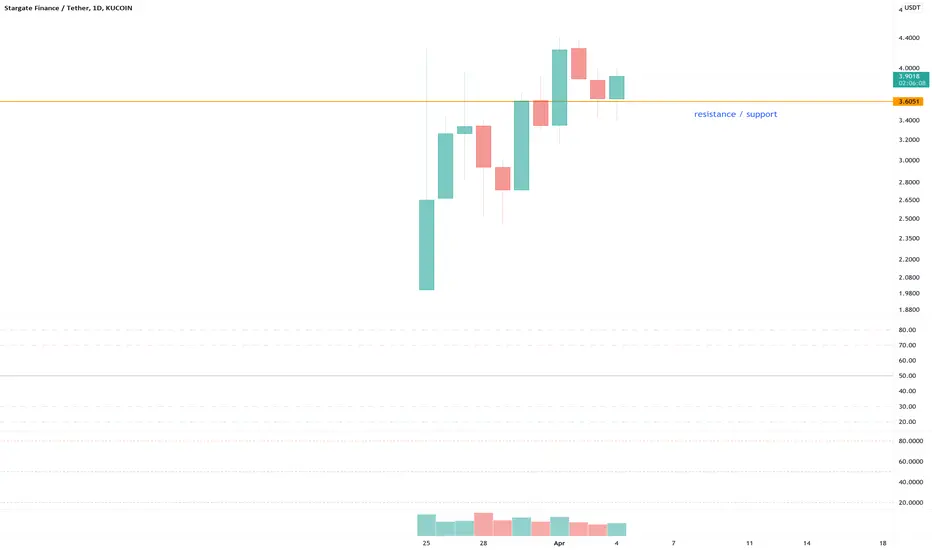
No TA today… no data to work with!
Protocols. That’s the name of this game, so I’m told. Chasing serious protocols. The apps that work on those protocols can attract nice returns, but not as much as the underlying. Right now there’s no more exciting topic than that of Layer 0 protocols. You’ve probably heard of layer 1 and 2 protocols, ETH and applications that operate on the Ethereum Blockchain are respectively layer 1 and layer 2. But what’s a layer 0 protocol?
“The Layer 0 blockchain lays the road for layer 1 blockchains. It gives the underlying infrastructure to create chains and also it allows cross-chain interoperability which means the chains created on top of layer 0 can communicate with each other.”
The research on Stargate Finance I can’t take credit for, I’m fortuitous enough to be made aware by others who dive deep into such matters thanks to the think tank. As far as they’re concerned this is like buying Ethereum in 2016. Who knows, thought it worth sharing.
Ww
stargate.finance/
Note
Forgot to add the layerZero homepage:layerzero.network/
Trade active
Timing market bottoms is not my thing however this might be a good moment. With such poor price action data to work with this is the first 'incredible buy' signal I've seen print on the 6hr chart.Trade active
Price action prints 'incredible buy' on both dollar and BTC pairs on the 12hr chart following a break of price action resistance.Note
That's the first time 'buy' signals have printed on the daily chart for both USD and BTC pairs.Note
First time ever a 'incredible buy' signal has printed on the 2-day chart for this token.Note
3-day BTC pair prints a incredible buy signal Trade active
4-day chart on the highest STG volume exchanges at this timeTrade active
Price action resistance breakout Note
Listed on Coinbase should you be wondering why price action pumped over 100%Trade active
Trade very active... you were warned!Do you see? Do you see what just printed?
This one made a ridiculous 200% when the conditions below last printed (see last update above).
Same chart with the indicator switched on. It is the blue circles on the bottom of the screen you want to give your attention to.
Ask below for updates, not trading this.
Note
Is actually possible to forecast a near term target of around $1.50 based on the falling wedge flagpole extension. Oddly enough it is also the Golden Pocket / Fibonacci 618Trade active
Confirmation of wedge breakout on daily With hammer candle printing on weekly chart
Price action is at a little overbought on the lower time frames. A limit order around 45 cents should be possible. However don’t concern timing the perfect entry too much when there is now a 200% projected upside to wedge target.
Trade active
Did you see?It just printed ;-)
BTC
bc1q2eckdzh0q8vsd7swcc8et6ze7s99khhxyl7zwy
Weblink: patreon.com/withoutworries
Allow 3-6 months on ideas. Not investment advice. DYOR
bc1q2eckdzh0q8vsd7swcc8et6ze7s99khhxyl7zwy
Weblink: patreon.com/withoutworries
Allow 3-6 months on ideas. Not investment advice. DYOR
Disclaimer
The information and publications are not meant to be, and do not constitute, financial, investment, trading, or other types of advice or recommendations supplied or endorsed by TradingView. Read more in the Terms of Use.