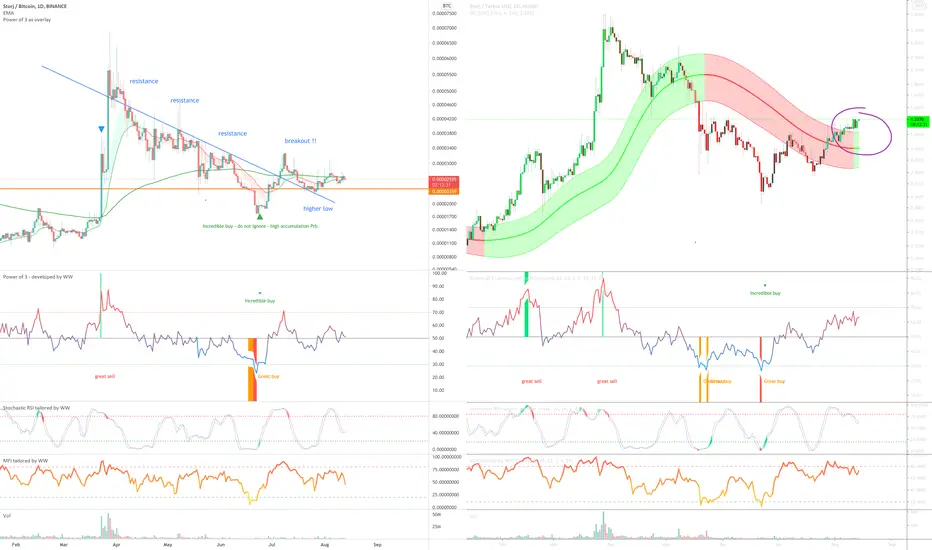
On the above 1-day STORJ/BTC chart (Left) a ‘incredible buy’ signal is shown following:
1) A 70% correction
2) Price action resistance breakout.
Price action is now printing higher low indicating a trend reversal.
On the weekly chart (below) price action prints a bullish engulfing candle following a test of Golden ratio. Excellent.
As for the USD chart (above right), a similar story with the BTC chart with price action recently breaking through the Gaussian channel following a changeover to green. Look left.
Good luck!
WW
Weekly chart
BTC
bc1q2eckdzh0q8vsd7swcc8et6ze7s99khhxyl7zwy
Weblink: patreon.com/withoutworries
Allow 3-6 months on ideas. Not investment advice. DYOR
bc1q2eckdzh0q8vsd7swcc8et6ze7s99khhxyl7zwy
Weblink: patreon.com/withoutworries
Allow 3-6 months on ideas. Not investment advice. DYOR
Disclaimer
The information and publications are not meant to be, and do not constitute, financial, investment, trading, or other types of advice or recommendations supplied or endorsed by TradingView. Read more in the Terms of Use.