Long
Buy STRAT, Be Smart
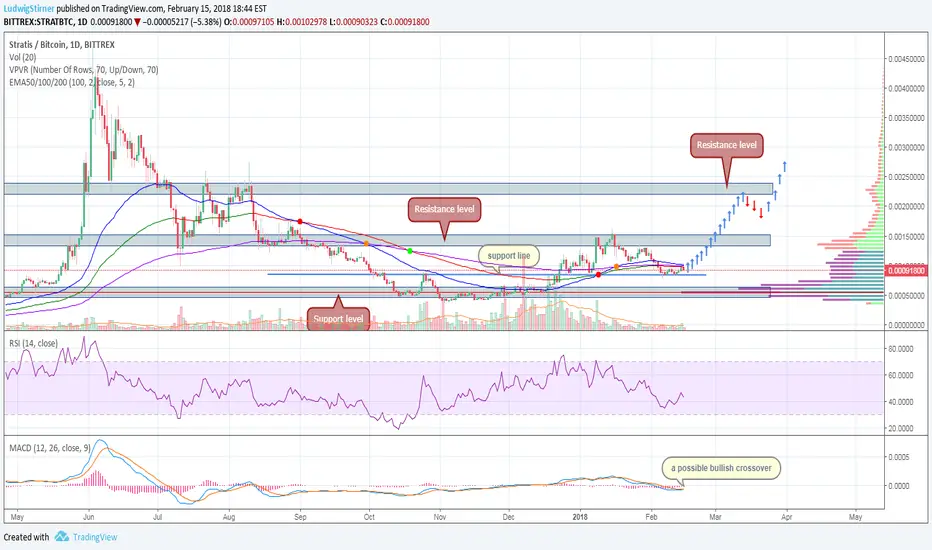
The daily time frame is the only time frame reflecting bullish clues. The 1D TF trend chart shows the formation of horizontal channel with resistance at the 200-Day moving average at the 0.001. There is support at the 0.0009 area. This is typical of a coins that is facing a slow growth after strong downtrend.
RSI is below 50 a sign of an downtrend, but this is due to the fact that in the last three days the BTC price has strengthened. The MACD line is turning up through its signal line giving a buy sign. The trend on the daily chart remains sideways between defined support and resistance. However, do not forget the fact that soon on the platform will be the first ICO.
RSI is below 50 a sign of an downtrend, but this is due to the fact that in the last three days the BTC price has strengthened. The MACD line is turning up through its signal line giving a buy sign. The trend on the daily chart remains sideways between defined support and resistance. However, do not forget the fact that soon on the platform will be the first ICO.
Disclaimer
The information and publications are not meant to be, and do not constitute, financial, investment, trading, or other types of advice or recommendations supplied or endorsed by TradingView. Read more in the Terms of Use.
Disclaimer
The information and publications are not meant to be, and do not constitute, financial, investment, trading, or other types of advice or recommendations supplied or endorsed by TradingView. Read more in the Terms of Use.