Starknet's Post-Listing Crucible: Forging a Bottom for the Next Rally
From Airdrop Volatility to a Foundational Base: Starknet's Path Forward in 2025
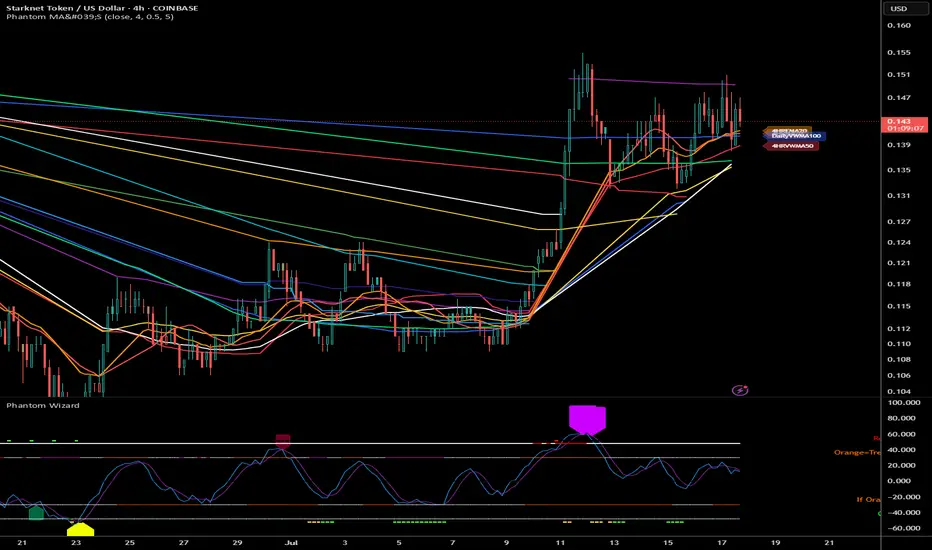
Starknet (STRK) is currently navigating the most critical phase of its young market lifecycle: the post-listing price discovery. Trading at approximately $0.143 as of July 17, 2025, the asset is emerging from the crucible of its initial token generation event. The preceding price action was not a traditional bear market but a period of intense supply absorption, primarily driven by airdrop recipients and early-stage investors. The chart now suggests this initial selling pressure is waning, and a structured accumulation base is being forged.
Current Market Context
The data captures the aftermath of STRK's launch. After an initial period of high volatility, the price entered a significant downtrend, culminating in a capitulation low of $0.096 in March 2025. This level represents the point of peak supply saturation, where the last of the short-term sellers likely capitulated into the hands of long-term conviction buyers. The subsequent price action has been a slow, methodical grind upwards, a textbook sign that the market is building a cause for a future, more sustainable trend.
Wyckoff Accumulation Schematic: Interpreting the Post-Launch Bottom
The price action from February to July 2025 aligns perfectly with a Wyckoff accumulation schematic, providing a powerful framework for understanding the market's behaviour after the initial listing supply shock.
Selling Climax (SC): The low at $0.096 represents the climax of airdrop-related selling pressure. This is the genesis low where the market first found significant, high-conviction demand.
Automatic Rally (AR) & Secondary Test (ST): The bounce to ~$0.13 (the AR) and the subsequent retest of the lows (the ST) established the boundaries of the new accumulation trading range. This phase defined the battlefield between residual supply and emerging demand.
Phase C - The Spring: The dip to $0.121 in late April served as a classic "Spring." This final shakeout was designed to liquidate late short positions and induce panic from weak hands before the true upward move began, effectively clearing the path.
Phase D - Last Point of Support (Current Phase): The current consolidation around $0.143 is a textbook "Last Point of Support" (LPS). The market is coiling, building energy, and undergoing a final test of supply within the range. This phase is critical as it demonstrates the market's ability to absorb any remaining sell-side pressure before attempting to leave the accumulation zone.
A decisive breakout above the range high near $0.24 would confirm the completion of this multi-month accumulation and signal the start of a new major uptrend (Phase E).
Moving Average & Ichimoku Cloud Analysis: A Trend in Transition
Key trend-following indicators are beginning to reflect this potential shift from a post-listing downtrend to a new uptrend.
Moving Averages (4-Hour Chart): The price is currently battling to establish the 50-period moving average (MA) as support. The 200 MA still looms overhead as the primary long-term trend resistance. The most anticipated technical event in the coming weeks is a "Golden Cross" (50 MA crossing above the 200 MA). This would serve as a widely recognized technical confirmation that the asset is exiting its bottoming phase.
Ichimoku Cloud (4-Hour Chart): Price is currently interacting with the Kumo (Cloud). A definitive break and close above the cloud would be a powerful signal, flipping the cloud from resistance to a dynamic support zone and confirming a bullish trend change on this timeframe.
Price Projection Timeline
Q3 2025 (July - September):
The primary objective is to complete Phase D with a sustained move above the $0.154 (38.2% Fib) and $0.172 (50% Fib) resistance levels. This would constitute the "Sign of Strength" (SOS) that signals an imminent attempt to break out of the accumulation range.
Q4 2025 (October - December):
Following a successful Q3, the focus will shift to conquering the major resistance at $0.24. This level represents the top of the Wyckoff range and a key psychological area from the initial listing period. A breakout above this zone would confirm the accumulation thesis and likely trigger a rapid expansion towards the first major target of $0.28 - $0.32.
Key Levels to Monitor
Support Zones:
Primary: $0.121 (The "Spring" level; must hold to maintain immediate bullish structure).
Major: $0.096 (The Post-Airdrop Low; the definitive floor of this market cycle).
Resistance & Target Zones:
Immediate: $0.154 (Fibonacci and structural resistance).
Target 1: $0.172 - $0.190 (The "Golden Pocket" resistance cluster).
Target 2 / Major Resistance: $0.24 (Top of the accumulation range).
Blue Sky Target 1 (Post-Breakout): $0.28 - $0.32.
Conclusion: The Foundation is Set, Awaiting Ignition
The technical evidence strongly indicates that Starknet has successfully navigated the initial, chaotic phase of its public life and has spent months building a robust accumulation base. The price action is not random but a structured absorption of the initial supply overhang.
While the path to $1.00 is a long-term journey that depends heavily on fundamental execution and market-wide sentiment, the technical roadmap for the remainder of 2025 is clear. The immediate goal is to validate the Wyckoff accumulation pattern by breaking out of the current range and reclaiming the $0.24 level. Achieving this would signal that the market has fully digested the launch-day supply and is ready to price the asset based on its future potential, setting the stage for a true bull run.
From Airdrop Volatility to a Foundational Base: Starknet's Path Forward in 2025
Starknet (STRK) is currently navigating the most critical phase of its young market lifecycle: the post-listing price discovery. Trading at approximately $0.143 as of July 17, 2025, the asset is emerging from the crucible of its initial token generation event. The preceding price action was not a traditional bear market but a period of intense supply absorption, primarily driven by airdrop recipients and early-stage investors. The chart now suggests this initial selling pressure is waning, and a structured accumulation base is being forged.
Current Market Context
The data captures the aftermath of STRK's launch. After an initial period of high volatility, the price entered a significant downtrend, culminating in a capitulation low of $0.096 in March 2025. This level represents the point of peak supply saturation, where the last of the short-term sellers likely capitulated into the hands of long-term conviction buyers. The subsequent price action has been a slow, methodical grind upwards, a textbook sign that the market is building a cause for a future, more sustainable trend.
Wyckoff Accumulation Schematic: Interpreting the Post-Launch Bottom
The price action from February to July 2025 aligns perfectly with a Wyckoff accumulation schematic, providing a powerful framework for understanding the market's behaviour after the initial listing supply shock.
Selling Climax (SC): The low at $0.096 represents the climax of airdrop-related selling pressure. This is the genesis low where the market first found significant, high-conviction demand.
Automatic Rally (AR) & Secondary Test (ST): The bounce to ~$0.13 (the AR) and the subsequent retest of the lows (the ST) established the boundaries of the new accumulation trading range. This phase defined the battlefield between residual supply and emerging demand.
Phase C - The Spring: The dip to $0.121 in late April served as a classic "Spring." This final shakeout was designed to liquidate late short positions and induce panic from weak hands before the true upward move began, effectively clearing the path.
Phase D - Last Point of Support (Current Phase): The current consolidation around $0.143 is a textbook "Last Point of Support" (LPS). The market is coiling, building energy, and undergoing a final test of supply within the range. This phase is critical as it demonstrates the market's ability to absorb any remaining sell-side pressure before attempting to leave the accumulation zone.
A decisive breakout above the range high near $0.24 would confirm the completion of this multi-month accumulation and signal the start of a new major uptrend (Phase E).
Moving Average & Ichimoku Cloud Analysis: A Trend in Transition
Key trend-following indicators are beginning to reflect this potential shift from a post-listing downtrend to a new uptrend.
Moving Averages (4-Hour Chart): The price is currently battling to establish the 50-period moving average (MA) as support. The 200 MA still looms overhead as the primary long-term trend resistance. The most anticipated technical event in the coming weeks is a "Golden Cross" (50 MA crossing above the 200 MA). This would serve as a widely recognized technical confirmation that the asset is exiting its bottoming phase.
Ichimoku Cloud (4-Hour Chart): Price is currently interacting with the Kumo (Cloud). A definitive break and close above the cloud would be a powerful signal, flipping the cloud from resistance to a dynamic support zone and confirming a bullish trend change on this timeframe.
Price Projection Timeline
Q3 2025 (July - September):
The primary objective is to complete Phase D with a sustained move above the $0.154 (38.2% Fib) and $0.172 (50% Fib) resistance levels. This would constitute the "Sign of Strength" (SOS) that signals an imminent attempt to break out of the accumulation range.
Q4 2025 (October - December):
Following a successful Q3, the focus will shift to conquering the major resistance at $0.24. This level represents the top of the Wyckoff range and a key psychological area from the initial listing period. A breakout above this zone would confirm the accumulation thesis and likely trigger a rapid expansion towards the first major target of $0.28 - $0.32.
Key Levels to Monitor
Support Zones:
Primary: $0.121 (The "Spring" level; must hold to maintain immediate bullish structure).
Major: $0.096 (The Post-Airdrop Low; the definitive floor of this market cycle).
Resistance & Target Zones:
Immediate: $0.154 (Fibonacci and structural resistance).
Target 1: $0.172 - $0.190 (The "Golden Pocket" resistance cluster).
Target 2 / Major Resistance: $0.24 (Top of the accumulation range).
Blue Sky Target 1 (Post-Breakout): $0.28 - $0.32.
Conclusion: The Foundation is Set, Awaiting Ignition
The technical evidence strongly indicates that Starknet has successfully navigated the initial, chaotic phase of its public life and has spent months building a robust accumulation base. The price action is not random but a structured absorption of the initial supply overhang.
While the path to $1.00 is a long-term journey that depends heavily on fundamental execution and market-wide sentiment, the technical roadmap for the remainder of 2025 is clear. The immediate goal is to validate the Wyckoff accumulation pattern by breaking out of the current range and reclaiming the $0.24 level. Achieving this would signal that the market has fully digested the launch-day supply and is ready to price the asset based on its future potential, setting the stage for a true bull run.
Discord.gg/CryptoIndicators
Disclaimer
The information and publications are not meant to be, and do not constitute, financial, investment, trading, or other types of advice or recommendations supplied or endorsed by TradingView. Read more in the Terms of Use.
Discord.gg/CryptoIndicators
Disclaimer
The information and publications are not meant to be, and do not constitute, financial, investment, trading, or other types of advice or recommendations supplied or endorsed by TradingView. Read more in the Terms of Use.