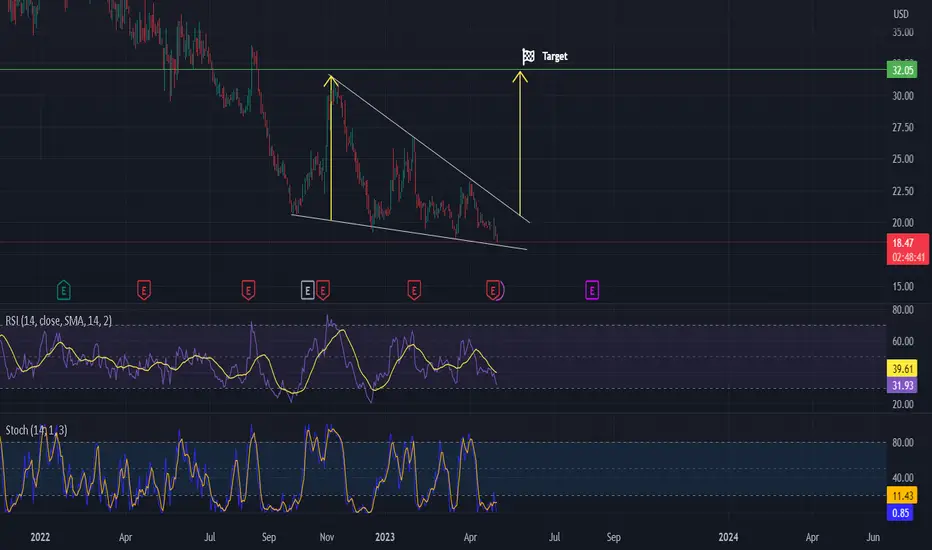
On this chart we can see a falling wedge pattern.
The RSI and Stochastics are both showing signs of oversold conditions.
Enter the long position once the price breaks out of the pattern.
Target is shown on the chart.
The RSI and Stochastics are both showing signs of oversold conditions.
Enter the long position once the price breaks out of the pattern.
Target is shown on the chart.
💥 Free signals and ideas ➡ t.me/vfinvestment
Disclaimer
The information and publications are not meant to be, and do not constitute, financial, investment, trading, or other types of advice or recommendations supplied or endorsed by TradingView. Read more in the Terms of Use.
💥 Free signals and ideas ➡ t.me/vfinvestment
Disclaimer
The information and publications are not meant to be, and do not constitute, financial, investment, trading, or other types of advice or recommendations supplied or endorsed by TradingView. Read more in the Terms of Use.