Technical Analysis – STX/USDT (Daily Timeframe)
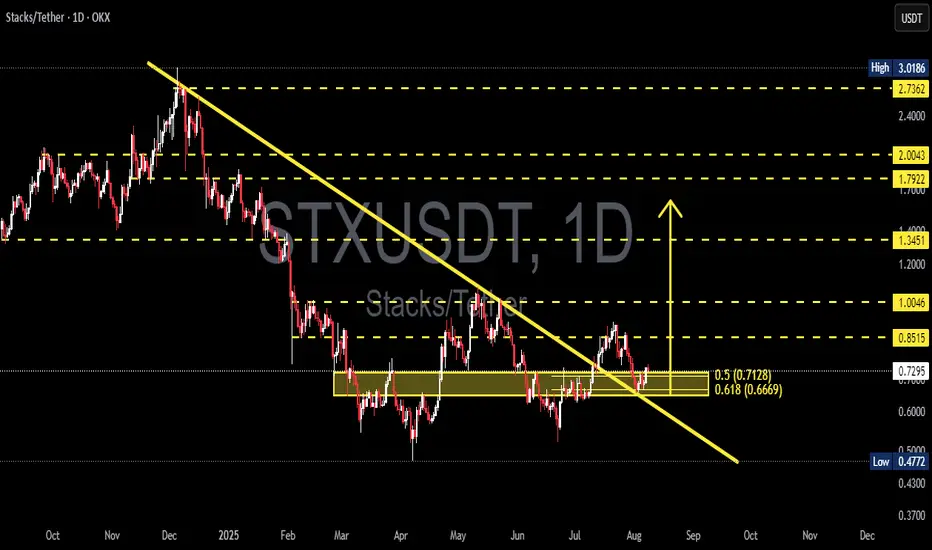
STX/USDT has shown a significant technical breakout after successfully breaching the descending trendline that has acted as a dynamic resistance since early 2025.
Currently, price is retesting a key support zone, which was a former resistance level—indicating a possible flip to demand and validation of the breakout.
---
🔹 Key Zone:
Demand zone (yellow box): 0.6669 – 0.7128
(based on Fibonacci retracement levels 0.618 and 0.5)
Current price: 0.7313
---
📈 Bullish Scenario:
Breakout from the descending trendline suggests a potential trend reversal.
As long as price holds above the 0.6669 – 0.7128 zone, upward continuation is likely.
Potential resistance targets:
0.8515
1.0046
1.3451
Extended target: 1.7922, if bullish momentum continues
---
📉 Bearish Scenario:
If price fails to hold the Fibonacci support zone, a deeper correction could follow.
Downside support levels to watch:
0.60 (psychological support)
0.4772 (2025 low)
---
📊 Pattern & Market Structure:
The trendline breakout is the first sign of a structural shift.
A successful retest and formation of a higher low could confirm a new bullish market structure.
The Fibonacci confluence zone aligns with price action support, making it a key decision area.
---
Conclusion:
STX/USDT is showing signs of recovery and a potential reversal after a prolonged downtrend. The breakout is promising, but confirmation will come if the price holds the key support zone. Traders should closely monitor the 0.6669 – 0.7128 region to gauge future price direction.
#STX #STXUSDT #CryptoBreakout #TrendReversal #FibonacciLevels #TechnicalAnalysis #Altcoins #CryptoTA #SupportResistance #PriceAction
✅ Get Free Signals! Join Our Telegram Channel Here: t.me/TheCryptoNuclear
✅ Twitter: twitter.com/crypto_nuclear
✅ Join Bybit : partner.bybit.com/b/nuclearvip
✅ Benefits : Lifetime Trading Fee Discount -50%
✅ Twitter: twitter.com/crypto_nuclear
✅ Join Bybit : partner.bybit.com/b/nuclearvip
✅ Benefits : Lifetime Trading Fee Discount -50%
Disclaimer
The information and publications are not meant to be, and do not constitute, financial, investment, trading, or other types of advice or recommendations supplied or endorsed by TradingView. Read more in the Terms of Use.