Analysis & Rationale:
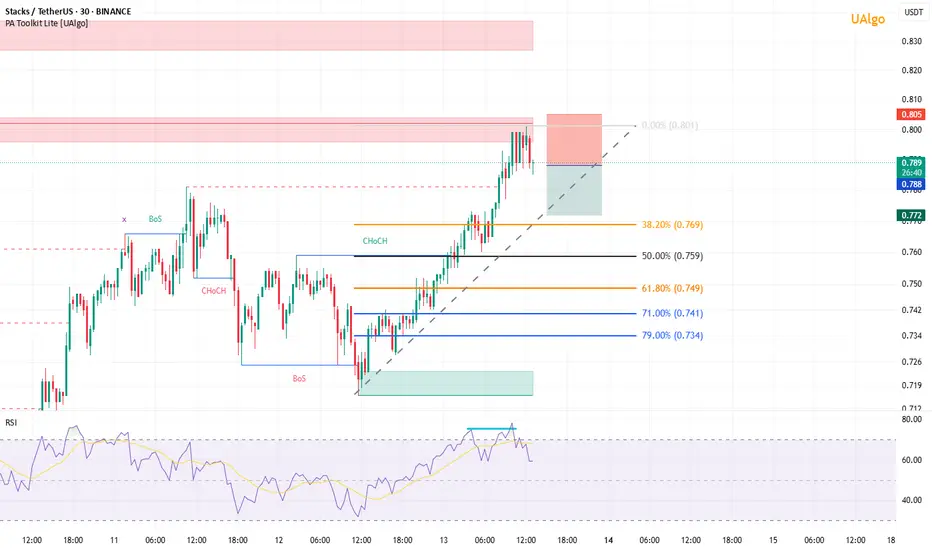
A high-probability short opportunity is forming on the STX/USDT 30-minute chart, primarily driven by a clear Bearish Divergence signal. While the price has registered a Higher High (HH), the Relative Strength Index (RSI) has failed to confirm this momentum, printing a Lower High (LH). This divergence indicates weakening buying pressure and a potential trend reversal or significant correction.
The price is currently reacting to a key supply/resistance zone (red box), which coincides with the RSI exiting the overbought territory. This confluence of signals strengthens the case for a bearish move.
Trade Setup:
Asset: STX/USDT
Timeframe: 30 Minutes
Direction: Short / Sell
Signal: Bearish Divergence
Execution Plan:
Entry Zone: Enter the short position near the current levels, within the supply zone (approximately $0.785 - $0.801).
Stop Loss: Place the Stop Loss just above the recent swing high to protect against a setup invalidation (e.g., at $0.805 or slightly above).
Take Profit Targets: Targets are based on the Fibonacci Retracement levels drawn from the previous swing low to the current high.
TP1: $0.769 (38.2% Fib. level)
TP2: $0.759 (50.0% Fib. level)
TP3: $0.749 (61.8% Fib. level)
Disclaimer: This analysis is for educational purposes only and does not constitute financial advice. Trading involves significant risk. Always conduct your own research and manage your risk appropriately.
Disclaimer
The information and publications are not meant to be, and do not constitute, financial, investment, trading, or other types of advice or recommendations supplied or endorsed by TradingView. Read more in the Terms of Use.
Disclaimer
The information and publications are not meant to be, and do not constitute, financial, investment, trading, or other types of advice or recommendations supplied or endorsed by TradingView. Read more in the Terms of Use.