Technical Analysis of SUPER CROP SAFE LTD
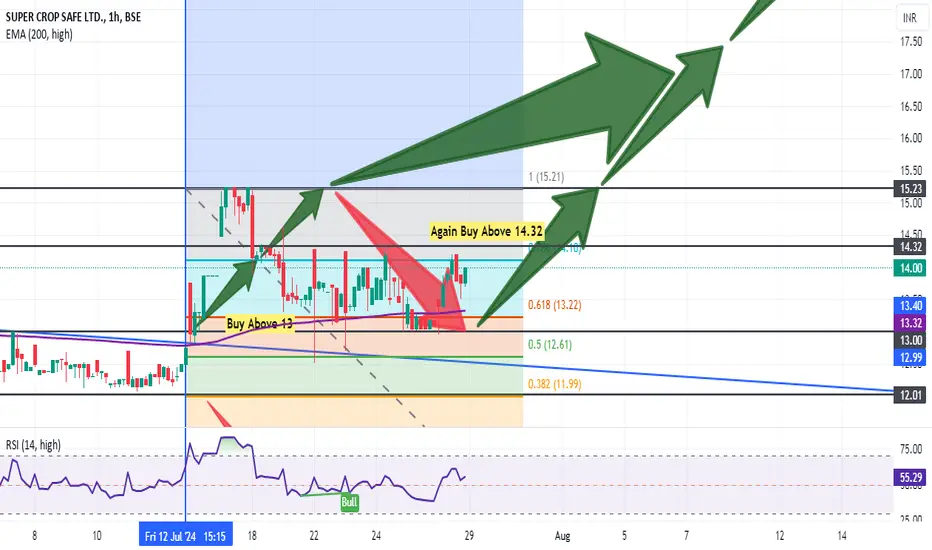
Overview of the Stock- The chart presents the historical price movement of SUPER CROP SAFE LTD. on the Bombay Stock Exchange (BSE). The timeframe appears to be hourly (1H). Key indicators include:
Price of the Stock: Current price is ₹13.75, up +1.60 (+13.17%) from the previous close.
High and Low: Today's high is 15.24, and the low is 11.78.
EMA (200, high): A 200-period Exponential Moving Average based on highs, currently at 9.51.
RSI (14, high): Relative Strength Index based on 14-period highs, currently at 56.10.
Technical Analysis
Price Action:- The stock has experienced significant upward movement in recent times, with a strong bullish trend. The current price is above the 200-period EMA, indicating potential bullish momentum. However, there seems to be some consolidation or retracement after a sharp rise, as indicated by the recent price action.
Indicators Used for Analysis:
RSI:- The RSI value of 56.10 suggests that the stock is in moderately overbought territory. This could indicate a potential correction or pullback in the near term.
EMA (200):-The 200-period EMA acting as support can be a crucial level to watch. If the price drops below this level, it could signal a potential change in trend.
Potential Outlook
Short Term: There's a possibility of a short-term correction or consolidation phase due to the overbought RSI and recent price action.
Long Term: The overall trend appears bullish, with the price above the 200-period EMA. If the stock manages to hold above this level, the uptrend could continue.
Further Considerations
Fundamental Analysis: It's essential to consider the company's financial performance, industry trends, and other fundamental factors to get a complete picture.
Risk Management: Implement appropriate risk management strategies, such as stop-loss orders, to protect your investment.
Diversification: Consider diversifying your portfolio to reduce risk.
Remember:
This analysis is based on limited information and should not be considered financial advice. Always conduct thorough research and consider consulting with a financial advisor before making investment decisions.
Disclaimer: This analysis is based solely on the provided chart and does not constitute financial advice. It's crucial to conduct thorough research and consider multiple factors before making investment decisions as I am not SEBI registered person and this is my personal opinion about the stock
Thanks for your support as always
Disclaimer
The information and publications are not meant to be, and do not constitute, financial, investment, trading, or other types of advice or recommendations supplied or endorsed by TradingView. Read more in the Terms of Use.
Disclaimer
The information and publications are not meant to be, and do not constitute, financial, investment, trading, or other types of advice or recommendations supplied or endorsed by TradingView. Read more in the Terms of Use.