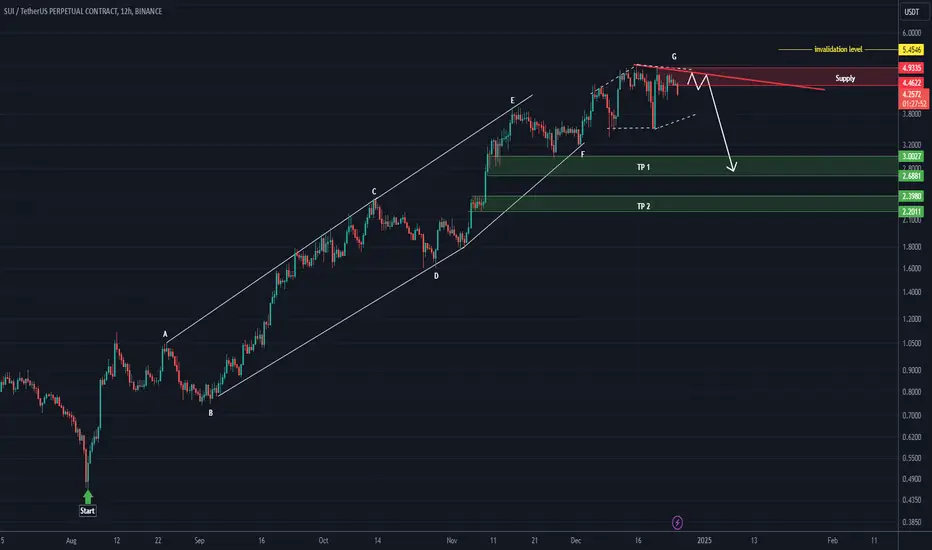
It seems that SUI is completing a large structure.
A diametric pattern appears to be forming at the end of wave G.
By maintaining the red descending trendline, it could drop toward the two specified TP levels marked on the chart.
Note that TP 1 is a strong support level.
A daily candle closing below the invalidation level will invalidate this analysis.
For risk management, please don't forget stop loss and capital management
When we reach the first target, save some profit and then change the stop to entry
Comment if you have any questions
Thank You
Trade closed: target reached
It slightly hunted the supply zone, but the invalidation level was not touched, so the analysis remained valid.The price has dropped over 50% from the supply zone Both TPs were hit.
The completion of SUI's higher-degree bullish wave was correctly identified.
🔆To succeed in trading, just enter our Telegram channel:
Free membership: t.me/Behdark_EN
🔷Our Telegram channel has daily spot and futures signals 👉 t.me/Behdark_EN
💎 Exclusive signals are only shared on our Telegram channel
Free membership: t.me/Behdark_EN
🔷Our Telegram channel has daily spot and futures signals 👉 t.me/Behdark_EN
💎 Exclusive signals are only shared on our Telegram channel
Disclaimer
The information and publications are not meant to be, and do not constitute, financial, investment, trading, or other types of advice or recommendations supplied or endorsed by TradingView. Read more in the Terms of Use.