Hello, dear traders and investors! 📈🚀
Let's dive into the analysis of SUIUSDT on the 1-hour timeframe and explore a promising trading opportunity. 🕵️♂️✨
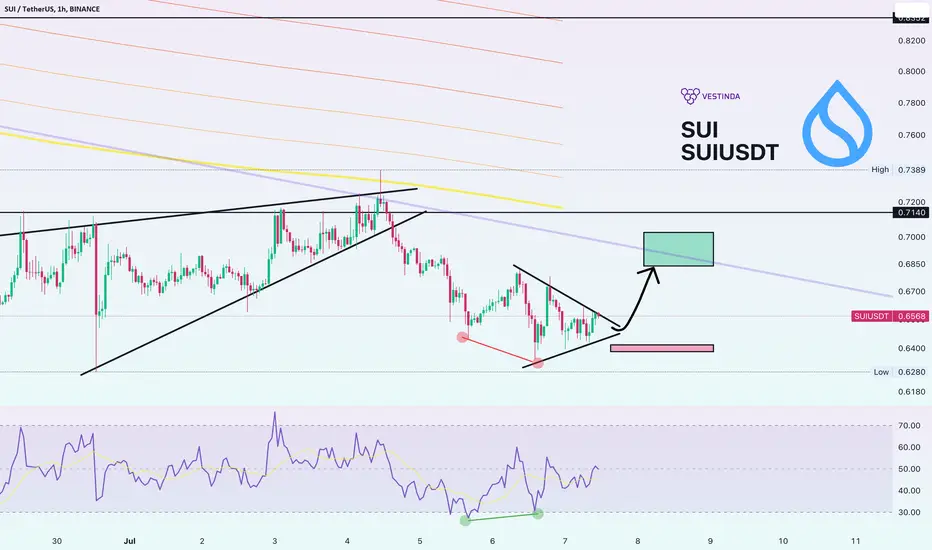
Upon careful examination, we can identify a compelling signal for a potential upward move, as both the price and the Relative Strength Index (RSI) are exhibiting a Bullish Divergence. This divergence pattern suggests a shift in momentum and a possible trend reversal to the upside.
💡 To further enhance your understanding of Bullish Divergence and its significance in trading, we invite you to check out our latest article on Divergence:
tradingview.com/chart/BTCUSDT/bXUjJiBV-The-Divergence-Cheat-Sheet-Your-Quick-Reference-Guide/.
👉Moreover, in addition to the Bullish Divergence, we can also observe the formation of a triangle shape pattern on the chart. This pattern indicates a period of consolidation before a potential breakout. Combining these two signals, we have a compelling case for a possible bullish move in the near term.
🚀 Taking into account the bullish divergence and the triangle pattern, our analysis suggests that the potential target for the upward move would be in the range of $0.69 to $0.71. This area represents a significant resistance level that could potentially be reached if the bullish momentum continues.
⛔️ It's essential to consider risk management in every trade. To protect against potential downside risk and invalidation of the bullish scenario, we recommend setting a stop loss and invalidation zone around $0.64. This will help safeguard your capital and ensure you are prepared for any unexpected market movements.
Remember to conduct thorough analysis and always make informed trading decisions based on your own risk tolerance and trading strategy.
Happy trading! 📊💰
Let's dive into the analysis of SUIUSDT on the 1-hour timeframe and explore a promising trading opportunity. 🕵️♂️✨
Upon careful examination, we can identify a compelling signal for a potential upward move, as both the price and the Relative Strength Index (RSI) are exhibiting a Bullish Divergence. This divergence pattern suggests a shift in momentum and a possible trend reversal to the upside.
💡 To further enhance your understanding of Bullish Divergence and its significance in trading, we invite you to check out our latest article on Divergence:
tradingview.com/chart/BTCUSDT/bXUjJiBV-The-Divergence-Cheat-Sheet-Your-Quick-Reference-Guide/.
👉Moreover, in addition to the Bullish Divergence, we can also observe the formation of a triangle shape pattern on the chart. This pattern indicates a period of consolidation before a potential breakout. Combining these two signals, we have a compelling case for a possible bullish move in the near term.
🚀 Taking into account the bullish divergence and the triangle pattern, our analysis suggests that the potential target for the upward move would be in the range of $0.69 to $0.71. This area represents a significant resistance level that could potentially be reached if the bullish momentum continues.
⛔️ It's essential to consider risk management in every trade. To protect against potential downside risk and invalidation of the bullish scenario, we recommend setting a stop loss and invalidation zone around $0.64. This will help safeguard your capital and ensure you are prepared for any unexpected market movements.
Remember to conduct thorough analysis and always make informed trading decisions based on your own risk tolerance and trading strategy.
Happy trading! 📊💰
💡 Elevate Your Trading Game! Join Vestinda's Vibrant Discord Community💬
📈 Discover insights, share strategies, and connect with fellow traders. Click to join: bit.ly/3rmVr9b 💜💜💜
📈 Discover insights, share strategies, and connect with fellow traders. Click to join: bit.ly/3rmVr9b 💜💜💜
Disclaimer
The information and publications are not meant to be, and do not constitute, financial, investment, trading, or other types of advice or recommendations supplied or endorsed by TradingView. Read more in the Terms of Use.