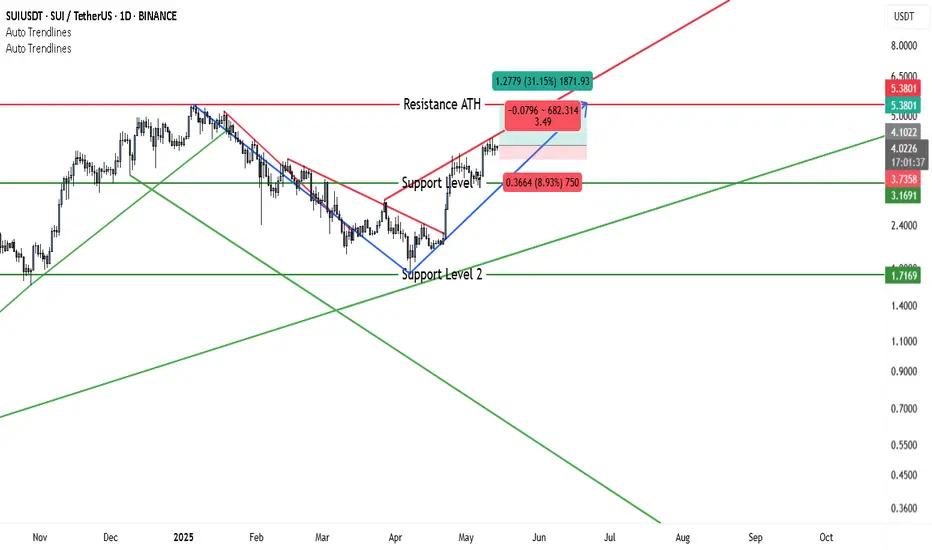
SUI/USDT is displaying a strong bullish recovery pattern on the daily chart. The pair has formed a textbook V-shaped reversal, bouncing sharply from the Support Level 2 at $1.7169. The trend has shifted from bearish to bullish, supported by the Auto Trend Line indicator which confirms the uptrend.
🔵 Bullish Structure Highlights
• Price has broken above the intermediate Support Level at $3.1691, converting it into a potential support zone.
• Current price action is hovering around $4.01, with bullish momentum aiming toward the ATH Resistance at $5.38.
• The sharp upward leg is part of a clear V-shaped recovery, suggesting a continuation toward previous highs.
🟢 Trade Setup (Bullish Swing Trade)
Trade Element Level (USD)
Entry Zone $3.73 – $4.01
Stop Loss $3.71
Take Profit $5.38
Risk:Reward ~4.6 R:R (approx.)
📌 Rationale
• The price is approaching a key psychological level and former resistance zone at $5.38, making it a logical profit target.
• A tight stop-loss at $3.71, just below recent consolidation, helps manage downside risk.
• The trend structure supports a bullish continuation pattern, likely driven by breakout traders.
⚠️ Risk Consideration
• If price closes below $3.71, the bullish structure may break down, invalidating the setup.
• Traders should always assess market conditions and manage leverage appropriately.
Trade forex, indices, stocks and metals with up to US$100.000 in company's funding.
Complete a challenge to access funding or go for instant deposit.
Trading involves substantial risk. Not financial advice
Complete a challenge to access funding or go for instant deposit.
Trading involves substantial risk. Not financial advice
Related publications
Disclaimer
The information and publications are not meant to be, and do not constitute, financial, investment, trading, or other types of advice or recommendations supplied or endorsed by TradingView. Read more in the Terms of Use.