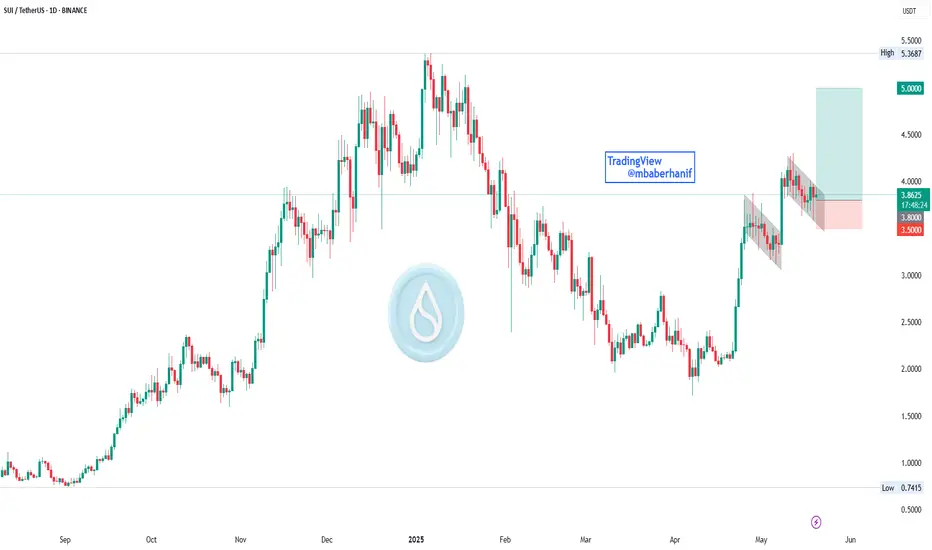
SUI shows a strong upward trend that began in April 2025, following a prolonged downtrend from January to March. The recent price action forms a bullish flag pattern—characterized by consolidation within parallel downward-sloping channels—signaling a continuation of the previous uptrend. The chart highlights two such bullish flags, with the most recent breakout occurring near the $3.80 level. A long trade setup is illustrated, with a stop-loss around $3.50 and a take-profit target near $5.00. This setup suggests a favorable risk-to-reward ratio and implies bullish sentiment as the asset attempts to resume its uptrend, aiming to break past prior resistance levels.
Disclaimer
The information and publications are not meant to be, and do not constitute, financial, investment, trading, or other types of advice or recommendations supplied or endorsed by TradingView. Read more in the Terms of Use.
Disclaimer
The information and publications are not meant to be, and do not constitute, financial, investment, trading, or other types of advice or recommendations supplied or endorsed by TradingView. Read more in the Terms of Use.