This chart is in expansion to our previous post:
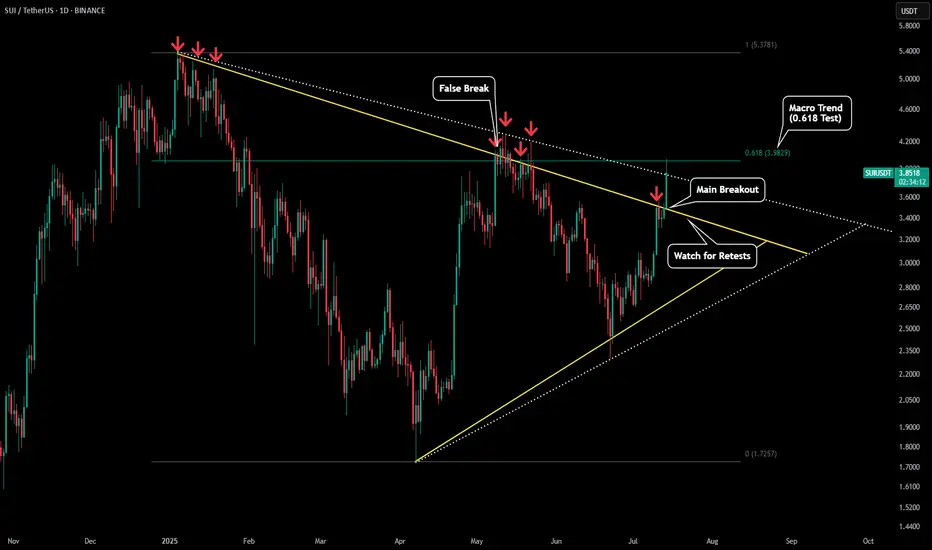
What we can see is SUI has clearly broken out of its symmetrical triangle (yellow trendlines). This is the first good sign for potential new highs for SUI.
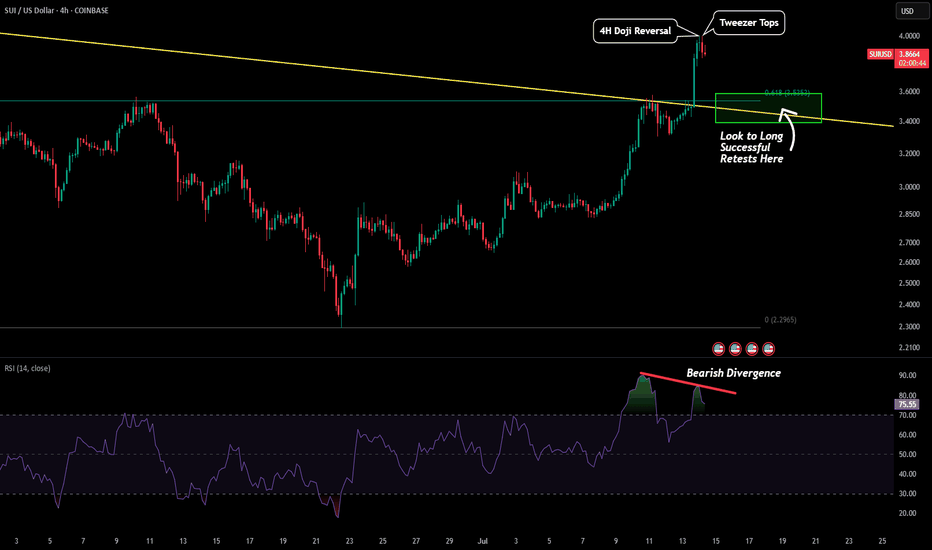
However since the 4H chart could be spelling out a short term drop lets see where price could go.
Right now it is testing the 0.618 of the macro trend as resistance. It could also be battling with the top range of wick price action (dotted white lines).
If price does fall on the 4H chart it could coincide with a retest of our yellow trendline.
If we get a retest and hold of that yellow trendline that will be the confirmation we need for a full blown breakout for SUI.
If we do not fall on the 4h chart and break back above the $4 level then price will head to the 0.786 ($4.60) followed by a test of the previous high.
What we can see is SUI has clearly broken out of its symmetrical triangle (yellow trendlines). This is the first good sign for potential new highs for SUI.
However since the 4H chart could be spelling out a short term drop lets see where price could go.
Right now it is testing the 0.618 of the macro trend as resistance. It could also be battling with the top range of wick price action (dotted white lines).
If price does fall on the 4H chart it could coincide with a retest of our yellow trendline.
If we get a retest and hold of that yellow trendline that will be the confirmation we need for a full blown breakout for SUI.
If we do not fall on the 4h chart and break back above the $4 level then price will head to the 0.786 ($4.60) followed by a test of the previous high.
Disclaimer
The information and publications are not meant to be, and do not constitute, financial, investment, trading, or other types of advice or recommendations supplied or endorsed by TradingView. Read more in the Terms of Use.
Disclaimer
The information and publications are not meant to be, and do not constitute, financial, investment, trading, or other types of advice or recommendations supplied or endorsed by TradingView. Read more in the Terms of Use.