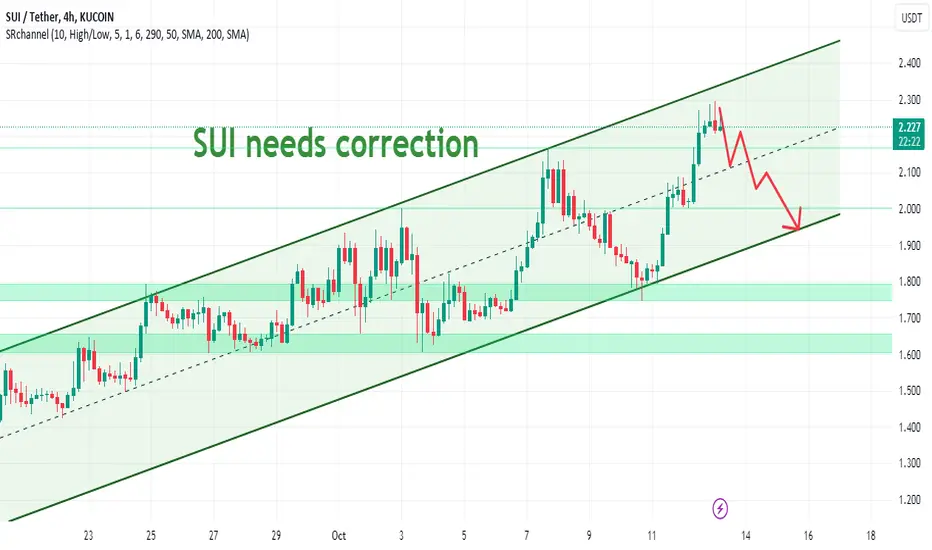
Currently, SUI is moving near the Resistance lines and the Potential Reversal Zone; as you see in 4h channel. SUI has been increase about 360% in two months. It seems that according to the good news that has come for the Sui project, the increase of the SUI token may continue, but it will experience a correction to increase again.
I expect SUI correction can be 20% - 30%. Follow the chart.
Enter: 2.25
TP1: 2.15
TP2: 2.0
TP3: 1.95
SL: 2.40
** Please follow your strategy and updates; this is just my Idea, and I will gladly see your ideas in this post.
I expect SUI correction can be 20% - 30%. Follow the chart.
Enter: 2.25
TP1: 2.15
TP2: 2.0
TP3: 1.95
SL: 2.40
** Please follow your strategy and updates; this is just my Idea, and I will gladly see your ideas in this post.
Trade active
First target reached --> 2.15 OKTrade active
2nd target reached --> 2.0 OKTrade active
As expected, SUI moved same as the chart pattern and reached to the end of channel (1.97). After touching, a pullback has been shaped. There is two senario, if up movment contniue strongly and break 2.28, the price will attempt to touch the head of channel again (2.45). Another senario, after a short pullback, SUI will continue the down trend and may breaks the channel supporting line. Based on market condition, I almost agree with this secound senario.... what do you think?! Trade active
Channel break down. Ready for next targets.Trade closed: target reached
Last target reached --> 1.95 OKgood job ;)
I think SU will continue down. Next target can be 1.9
Trade active
As expected, 1.9 touched. In think base on 1hrs time frame cannel and market condition we will see next target (1.81 USDT) soon.Trade closed: target reached
Next target reached --> 1.81 OKAll steps went exactly as expected ;) :D
Trade active
SUI moved as expected and touched all targets. Now, it has been shaped a new channel in 1hrs time frame (as see bellow). In my opponion down trend will continue. Follow the chart; everything is clear. (TP1: 1.4)Trade closed: target reached
Target reached --> 1.4 OKgood job ;)
Disclaimer
The information and publications are not meant to be, and do not constitute, financial, investment, trading, or other types of advice or recommendations supplied or endorsed by TradingView. Read more in the Terms of Use.
Disclaimer
The information and publications are not meant to be, and do not constitute, financial, investment, trading, or other types of advice or recommendations supplied or endorsed by TradingView. Read more in the Terms of Use.