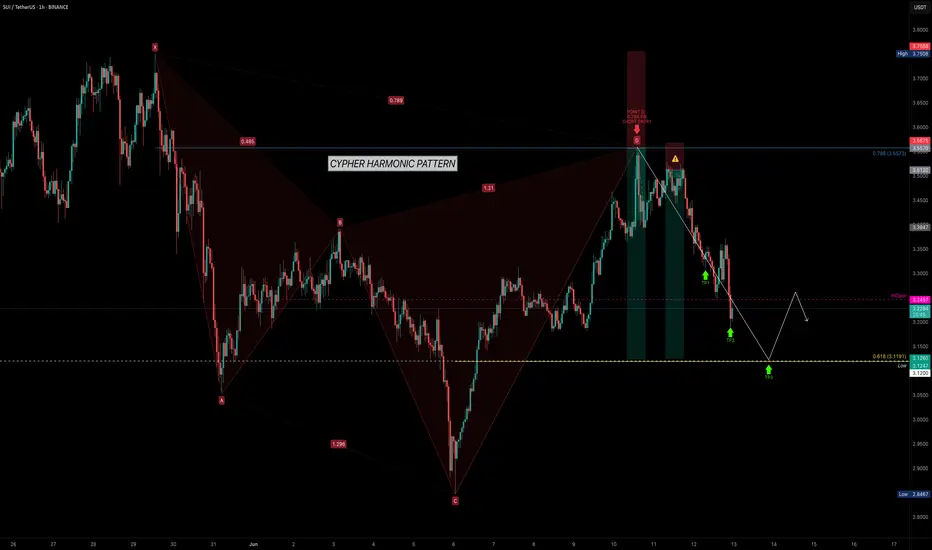
SUI has been respecting technical levels with remarkable consistency. After bouncing from the $2.8467 low, it surged sharply — completing a clean Cypher Harmonic Pattern. This led to a high-probability short setup at the 0.786 Fibonacci retracement (Point D) around $3.5573.
🎯 Trade Setup Breakdown
The 0.618 fib retracement of the CD leg coincides with a significant key low from May 6, 2025, adding structural confluence. This is an ideal level to monitor for absorption, reaction, or potential reversal behaviour.
🧠 Educational Insight: How to Trade Harmonic Patterns Like a Pro
Harmonic patterns aren't just visually appealing — they represent high-probability setups based on market structure, Fibonacci geometry, and behavioural cycles. The most critical part of every harmonic pattern?
Whether the pattern is bullish or bearish, Point D is your trigger:
This works because Point D marks the exhaustion of the corrective leg, where trapped traders and liquidity often sit. The structure often aligns with supply or demand zones, order blocks, or FVGs (Fair Value Gaps).
💡 Important: Harmonic patterns are most effective on higher timeframes — 4H and above. On lower timeframes, noise increases and reliability drops significantly. For clean execution and meaningful structure, stay with mid to high timeframes.
Here’s how to trade it effectively:
✅ Wait for the full pattern to form — don’t front-run
✅ Use fib levels and structure confluence to validate Point D
✅ Use order flow tools (like Exocharts) to confirm absorption or volume shift
✅ Enter on Point D with your stop-loss just beyond X
✅ Take profits at common retracement levels like the 0.382 or 0.618 of the CD leg
Patience is key. Harmonic traders wait for the market to complete the cycle — then strike with a plan.
📌 Final Thoughts
SUI is delivering clean harmonic respect, and this setup is no exception. Whether you're already short or waiting for further confirmation, keep an eye on volume, liquidity zones, and reaction levels around $3.1191. If this zone holds, it may serve as a pivot for the next move.
Pattern. Precision. Patience. That's how you catch high-probability trades like this.
_________________________________
💬 If you found this helpful, drop a like and comment!
Want breakdowns of other charts? Leave your requests below.
🎯 Trade Setup Breakdown
- Pattern: Cypher Harmonic
- Entry (Point D): $3.5573 (0.786 retracement of XC)
- Target: $3.1191 (0.618 retracement of CD)
- Stop-Loss: Above Point X
The 0.618 fib retracement of the CD leg coincides with a significant key low from May 6, 2025, adding structural confluence. This is an ideal level to monitor for absorption, reaction, or potential reversal behaviour.
🧠 Educational Insight: How to Trade Harmonic Patterns Like a Pro
Harmonic patterns aren't just visually appealing — they represent high-probability setups based on market structure, Fibonacci geometry, and behavioural cycles. The most critical part of every harmonic pattern?
- You enter at Point D.
Whether the pattern is bullish or bearish, Point D is your trigger:
- In bearish patterns (like this Cypher), you short from Point D.
- In bullish patterns, you long from Point D.
This works because Point D marks the exhaustion of the corrective leg, where trapped traders and liquidity often sit. The structure often aligns with supply or demand zones, order blocks, or FVGs (Fair Value Gaps).
💡 Important: Harmonic patterns are most effective on higher timeframes — 4H and above. On lower timeframes, noise increases and reliability drops significantly. For clean execution and meaningful structure, stay with mid to high timeframes.
Here’s how to trade it effectively:
✅ Wait for the full pattern to form — don’t front-run
✅ Use fib levels and structure confluence to validate Point D
✅ Use order flow tools (like Exocharts) to confirm absorption or volume shift
✅ Enter on Point D with your stop-loss just beyond X
✅ Take profits at common retracement levels like the 0.382 or 0.618 of the CD leg
Patience is key. Harmonic traders wait for the market to complete the cycle — then strike with a plan.
📌 Final Thoughts
SUI is delivering clean harmonic respect, and this setup is no exception. Whether you're already short or waiting for further confirmation, keep an eye on volume, liquidity zones, and reaction levels around $3.1191. If this zone holds, it may serve as a pivot for the next move.
Pattern. Precision. Patience. That's how you catch high-probability trades like this.
_________________________________
💬 If you found this helpful, drop a like and comment!
Want breakdowns of other charts? Leave your requests below.
Note
📚 The Cypher Harmonic Pattern — How to Trade It EffectivelyThe Cypher is one of the most reliable advanced harmonic patterns and to be honest, it’s my favourite pattern to trade... when combined with confluence like order flow or liquidity zones, it becomes a real weapon. It offers clear risk-to-reward setups and works best on higher timeframes like the 4H, Daily, or Weekly. Its structure helps traders anticipate high-probability reversals using Fibonacci precision.
🔷 Cypher Pattern Structure: The Rules
The Cypher pattern consists of 5 points: X, A, B, C, and D — with very specific Fibonacci conditions.
- XA: Initial leg.
- AB: Retraces 0.382 to 0.618 of XA.
- BC: Extends to at least 1.272 but not more than 1.414 of XA.
- CD (Final Leg): Retraces 0.786 of XC — this is the trade entry.
🧠 How to Trade It
Trade Direction:
You trade the reversal at Point D:
- If the pattern is bearish (XABCD slopes upward), you short from Point D.
- If the pattern is bullish (XABCD slopes downward), you long from Point D.
📍 Entry:
- Enter at the 0.786 Fibonacci retracement of the XC leg. This is the ideal Point D zone.
📌 Stop-Loss (Invalidation):
- Place the stop-loss just above/below the X point (the origin of the pattern).
- If price breaches X with a confirmed close or strong breakout, the pattern is invalid.
💰 Take Profit Targets:
Standard targets are Fibonacci retracements of the CD leg:
- TP1: 0.382 of CD
- TP2: 0.618 of CD
- TP3: Point A
- TP4 (optional): Point C or trailing beyond if momentum builds
These targets offer high R:R setups — often 1:3 to 1:6 depending on structure.
🟢 When Is the Pattern Considered “Completed”?
A harmonic pattern is considered completed when:
✅ Price hits the minimum 0.382 retracement of the CD leg, preferably reaches the 0.618 retracement or Point A
✅ Price shows reaction (rejection, reversal structure, or SFP) at Point D
Once these criteria are met, the trade idea is fulfilled, and new structure should be awaited.
📌 Note: Never hold onto a harmonic trade after targets are met or invalidation is hit. Harmonics are precise, and overstaying reduces your edge.
🎓 Pro Tips
Always use confluence: combine harmonics with order flow (e.g. SFP, volume spikes), support/resistance, VWAP, or liquidity zones for extra confirmation.
-> Don’t force patterns — let them build naturally.
Best traded in strong trending or corrective phases!
Trade closed: target reached
✅ Cypher Harmonic Completed — What Comes Next for SUI?
The Cypher Harmonic pattern on SUI has officially played out. Price reached both of its primary downside targets — the 0.618 retracement of the CD leg and Point A — marking the successful completion of the pattern.
🧠 What This Means:
- The 0.618 retracement of CD (~$3.1191) was hit.
🚫 No Reaction at 0.618 CD = Weak Bullish Interest. The failure to bounce at the 0.618 fib (CD) — typically a high-probability take-profit zone or long entry — signals that bulls were either sidelined or outpaced by heavy sell pressure.
- Point A was also taken out, confirming full pattern completion.
- The 0.886 Fibonacci retracement level acted as support, aligning perfectly with the 1.618 trend-based Fibonacci extension at $2.928 — a key confluence zone.
This pattern has done its job — providing a well-defined short setup from the 0.786 fib entry (~$3.5573) and delivering a high R:R opportunity.
🔍 Time to Shift Focus: What’s the Next Setup?
Now that the Cypher is complete, it’s crucial to zoom out and reassess the chart structure:
1. Are we seeing signs of accumulation or continuation to the downside?
2. Is a new harmonic pattern forming (e.g., potential Gartley, Bat, or Butterfly)?
3. What do higher timeframe fib levels suggest?
This is the moment where patient traders look for new structure — not force entries.
📚 Trading Insight:
Harmonic patterns give structure to price — but once they’re played out, the edge is gone. Never cling to a pattern after its targets are fulfilled. Instead, let the market reset and form new opportunities. This is how you stay objective and consistent.
Note
🔍 The Next Move — Mapping the New SetupFollowing the sell-off, price found support precisely at the 0.886 retracement of CD ($2.928), in perfect confluence with the 1.618 trend-based Fib extension — highlighting a reaction zone.
From here, the market has two key possibilities:
🔄 Scenario A: Relief Rally Before Lower (more likely)
A short-term bounce toward the $3.14–$3.15 area, aligning with:
• 0.5 fib of the last leg down
• 0.786 trend-based fib retest
• S/R zone
→ This could provide a lower high and potential short opportunity back into the $2.70s region, where the 0.618 fib of the full swing sits (~$2.7035).
🔄 Scenario B: Immediate Continuation Lower (less likely)
If price fails to reclaim $3.05–$3.10 convincingly, we may see continuation toward the $2.70 area without a relief bounce. This aligns with:
• 0.618 fib at $2.7035
• Unfilled liquidity pocket
• Possible bullish re-entry zone if confirmed
📚 Harmonic Recap: Why This Matters
Harmonic patterns like the Cypher provide clear rules:
• You trade Point D — not before, not after
• TP is typically the 0.618 retracement of CD
• TP can be Point A or deeper extensions
This structure played out beautifully and has now ended. What comes next is an entirely new trade setup — so adjust your bias accordingly.
💬 Keep Watching:
→ Price behaviour at $3.14–$3.15
→ If price fails to bounce, watch for buys near $2.70
Stay reactive, not predictive. The best setups come to those who wait.
Note
🚨 SUI Update — Precision Rejection & ReactionSUI followed through exactly as mapped out.
✅ Price rallied into confluence resistance at the 0.786 Trend-Based Fib Extension (TBFE) and the 0.5 Fibonacci Retracement (FR), offering a short entry.
🎯 It tapped the 0.786 TBFE to the $ and rejected, dropping -15% into the golden pocket target zone ($2.7).
🔁 The drop found support right at the 0.618 FR, where we saw an immediate bounce, validating the level as a key reaction zone.
Structure, confluence, and fibs all aligned perfectly. Let’s now watch how price behaves around the 0.618 level for the next possible play.
Note
🧩 SUI Fractal Replay: The Market’s Memory in Action
SUI has just completed a fascinating pattern — replaying its own previous structure in nearly perfect fractal form. If you look at the chart, you’ll notice that the left side shows the original price action from early June, which led into a sharp breakdown. That structure has now essentially been “copied and pasted” by the market, forming the same distribution range, fakeouts, and dump — just on a smaller scale.
→ Both fractals ended with a rejection at the 0.786 Fibonacci
Each time, this level acted as resistance, producing a reversal. In the current fractal, price dropped -15% from the 0.786 mark toward the 0.618 fib retracement.
Markets tend to repeat patterns of behaviour — not because of magic — but because they are driven by the same psychology, liquidity dynamics, and order flow that underpin all price movement. This is the power of fractals.
🎯 Technical Summary:
* Clear fractal duplication of the June structure
* Major rejections both times at the 0.786 Fibonacci level
* Price dropped directly into the 0.618 Fibonacci retracement
* Confluence between structure, fib levels, and behaviour
🧠 Educational Insight: Why Fractals Matter in Trading
Fractals are recurring price patterns that repeat at different scales and timeframes. They reflect the self-similar nature of markets — where crowd behaviour and liquidity dynamics often unfold in predictable ways, regardless of the asset or timeframe.
By identifying fractals, traders gain a powerful edge:
✔ They help anticipate future price moves based on past structure
✔ They enhance timing and confidence in entries/exits
✔ They reveal market rhythm and psychological zones (liquidity hunts, consolidations, reversals)
In this case, SUI mirrored its prior structure almost 1:1. Recognising such patterns gives you early signals — especially when they align with other technicals.
Fractals are clues from the market’s memory — patterns repeat, and those who see them first usually profit most.
🏆 Mastering Fibonacci for precision trading
🔹 Sharing high-probability trade setups
⚡ Unlock the power of technical analysis!
🔹 Sharing high-probability trade setups
⚡ Unlock the power of technical analysis!
Related publications
Disclaimer
The information and publications are not meant to be, and do not constitute, financial, investment, trading, or other types of advice or recommendations supplied or endorsed by TradingView. Read more in the Terms of Use.