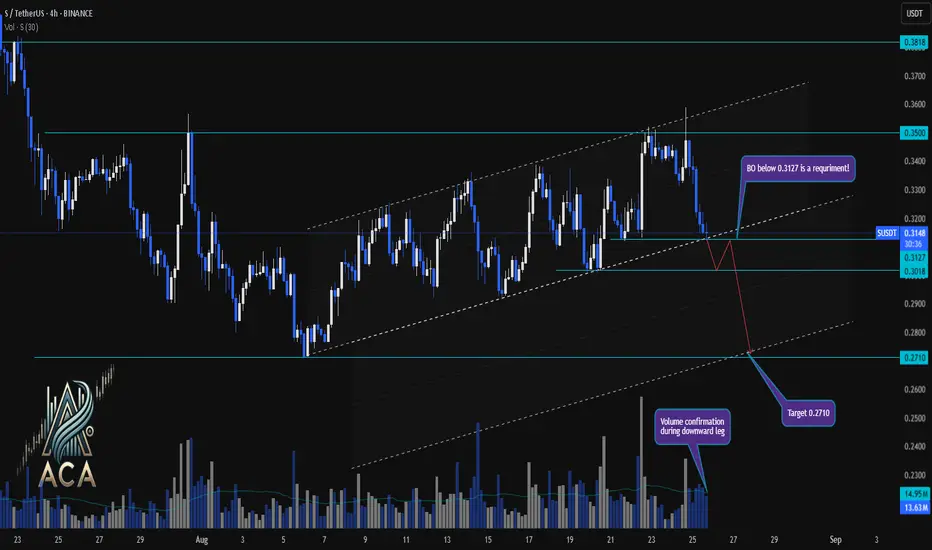
SUSDT 4H Chart Analysis | Channel Breakdown Looms
🔍 Let’s break down the recent price action on the S/USDT 4-hour chart, focusing on the pivotal ascending channel structure and its implications for the next move.
⏳ 4-Hour Overview
S/USDT has been moving within a well-defined ascending channel, marked by higher highs and higher lows. Price is now testing the lower boundary of this channel, making the 0.3127 support a crucial level. The recent uptick in volume during the downward leg hints at mounting bearish pressure.
🔻 Short Setup:
A confirmed breakdown (BO) below 0.3127 would signal an exit from the ascending channel, opening the door to accelerated downside. With channel support breached, the next key target sits at 0.2710, in line with historical liquidity and the channel’s projected lower range.
📊 Key Highlights:
- Price action is currently at the channel’s lower boundary, with a breakdown below 0.3127 required to confirm bearish momentum.
- Volume has increased on the recent downward move, supporting the idea of a channel exit and follow-through selling.
- Downside target stands at 0.2710 if the channel fails, providing a clear roadmap for action.
🚨 Conclusion:
Bulls must defend the ascending channel at 0.3127, or risk seeing S/USDT cascade toward 0.2710. Watch for volume confirmation—an exit below channel support could shift sentiment quickly.
Disclaimer
The information and publications are not meant to be, and do not constitute, financial, investment, trading, or other types of advice or recommendations supplied or endorsed by TradingView. Read more in the Terms of Use.
Disclaimer
The information and publications are not meant to be, and do not constitute, financial, investment, trading, or other types of advice or recommendations supplied or endorsed by TradingView. Read more in the Terms of Use.
