🔹 Market Structure Overview:
Ascending Trendline Support:
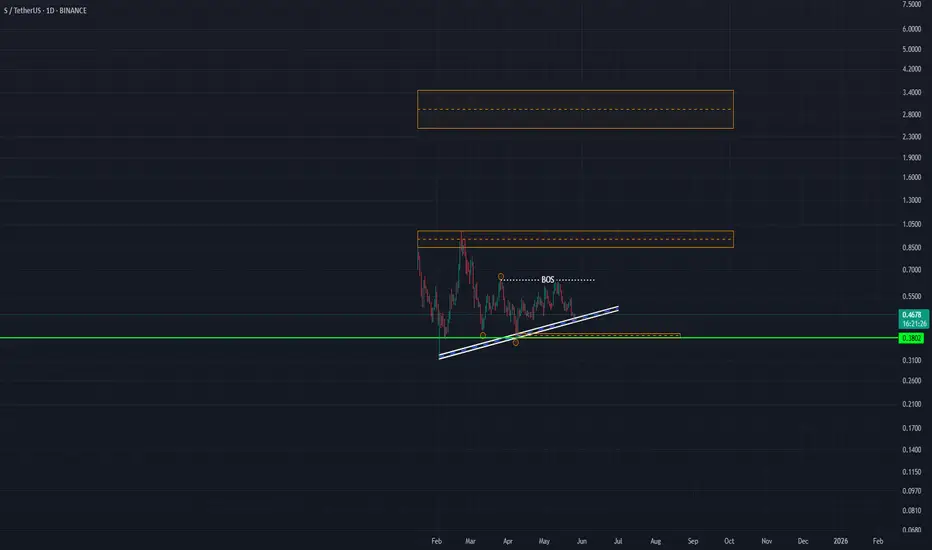
Price continues to respect an ascending support trendline (white and blue), creating a series of higher lows — a bullish structural sign. This trendline has acted as a launchpad multiple times and currently supports price around $0.46.
Break of Structure (BOS):
A bullish BOS has occurred above local highs, indicating smart money interest and a potential shift in market direction. This BOS is a critical reference for validating bullish continuation.
Key Demand Zone:
The $0.38 area (green line and orange box) is a strong demand level, previously used as a reaction point. This level aligns with trendline confluence and will be crucial for maintaining upward momentum.
Liquidity Events:
Multiple liquidity sweeps (highlighted with orange circles) show classic signs of stop hunts below previous lows and highs — behavior often linked with institutional accumulation.
🔸 Upside Targets:
Target 1: $0.88 – $1.05
A well-defined supply zone from previous distribution, likely to act as a magnet if bullish pressure continues.
Target 2: $2.80 – $3.40
A larger macro imbalance zone, likely to be targeted in a stronger trend expansion phase. This would require sustained bullish structure and volume.
🧠 Conclusion:
The chart presents a well-structured bullish scenario underpinned by SMC principles. As long as the trendline and $0.38 demand zone hold, bulls are in control. A confirmed breakout above $0.60 would open the path to higher targets, while a break below $0.38 would invalidate the setup and shift the bias bearish.
Ascending Trendline Support:
Price continues to respect an ascending support trendline (white and blue), creating a series of higher lows — a bullish structural sign. This trendline has acted as a launchpad multiple times and currently supports price around $0.46.
Break of Structure (BOS):
A bullish BOS has occurred above local highs, indicating smart money interest and a potential shift in market direction. This BOS is a critical reference for validating bullish continuation.
Key Demand Zone:
The $0.38 area (green line and orange box) is a strong demand level, previously used as a reaction point. This level aligns with trendline confluence and will be crucial for maintaining upward momentum.
Liquidity Events:
Multiple liquidity sweeps (highlighted with orange circles) show classic signs of stop hunts below previous lows and highs — behavior often linked with institutional accumulation.
🔸 Upside Targets:
Target 1: $0.88 – $1.05
A well-defined supply zone from previous distribution, likely to act as a magnet if bullish pressure continues.
Target 2: $2.80 – $3.40
A larger macro imbalance zone, likely to be targeted in a stronger trend expansion phase. This would require sustained bullish structure and volume.
🧠 Conclusion:
The chart presents a well-structured bullish scenario underpinned by SMC principles. As long as the trendline and $0.38 demand zone hold, bulls are in control. A confirmed breakout above $0.60 would open the path to higher targets, while a break below $0.38 would invalidate the setup and shift the bias bearish.
Disclaimer
The information and publications are not meant to be, and do not constitute, financial, investment, trading, or other types of advice or recommendations supplied or endorsed by TradingView. Read more in the Terms of Use.
Disclaimer
The information and publications are not meant to be, and do not constitute, financial, investment, trading, or other types of advice or recommendations supplied or endorsed by TradingView. Read more in the Terms of Use.