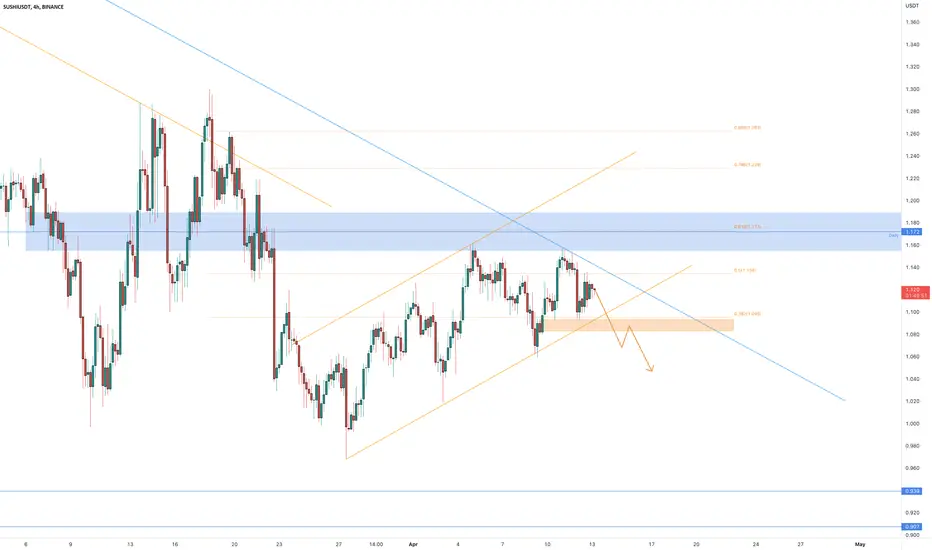
An ascending channel is a technical chart pattern formed by drawing two parallel trendlines connecting a series of higher lows and higher highs. The pattern can indicate an uptrend, with buyers continuing to enter the market at higher and higher prices. The upper trendline represents a resistance level, while the lower trendline represents a support level. Traders often use the upper and lower trendlines to identify potential buying and selling opportunities.
According to Plancton's Rules, if the price of
Disclaimer
The information and publications are not meant to be, and do not constitute, financial, investment, trading, or other types of advice or recommendations supplied or endorsed by TradingView. Read more in the Terms of Use.
Disclaimer
The information and publications are not meant to be, and do not constitute, financial, investment, trading, or other types of advice or recommendations supplied or endorsed by TradingView. Read more in the Terms of Use.