Dear TradingView community and fellow traders,
I am Richard, also known as theSignalyst.
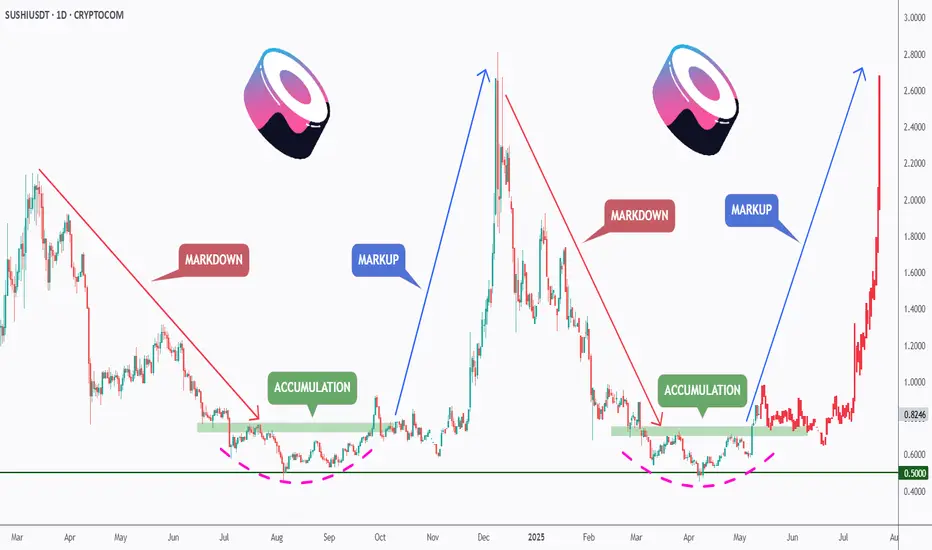
I find the SUSHI 🍣 daily chart intriguing, as it seems to be following the classic Wyckoff Cycle 📈.
If history repeats itself, we’ve just broken out of the accumulation phase ✅, highlighted in green 🟩.
As long as the bulls 🐂 remain in control, the markup phase may have just begun—potentially pushing SUSHI as high as $2.5 🚀.
❓ What's next?
Will SUSHI continue to trade higher from here, or will this cycle play out differently?
I hope you find this post useful, and I would appreciate your likes and support.
Which scenario do you think is more likely to happen first? and why?
📚 Always follow your trading plan regarding entry, risk management, and trade management.
Good luck!
All Strategies Are Good; If Managed Properly!
~Richard
I am Richard, also known as theSignalyst.
I find the SUSHI 🍣 daily chart intriguing, as it seems to be following the classic Wyckoff Cycle 📈.
If history repeats itself, we’ve just broken out of the accumulation phase ✅, highlighted in green 🟩.
As long as the bulls 🐂 remain in control, the markup phase may have just begun—potentially pushing SUSHI as high as $2.5 🚀.
❓ What's next?
Will SUSHI continue to trade higher from here, or will this cycle play out differently?
I hope you find this post useful, and I would appreciate your likes and support.
Which scenario do you think is more likely to happen first? and why?
📚 Always follow your trading plan regarding entry, risk management, and trade management.
Good luck!
All Strategies Are Good; If Managed Properly!
~Richard
Trade Made Simple
RichTL.com
Instagram:
instagram.com/richthesignalyst
Telegram
t.me/thesignalyst
Best CFD broker - Tickmill
cutt.ly/TickmillReal
Kucoin Exchange
kucoin.com/r/af/signalyst
RichTL.com
Instagram:
instagram.com/richthesignalyst
Telegram
t.me/thesignalyst
Best CFD broker - Tickmill
cutt.ly/TickmillReal
Kucoin Exchange
kucoin.com/r/af/signalyst
Disclaimer
The information and publications are not meant to be, and do not constitute, financial, investment, trading, or other types of advice or recommendations supplied or endorsed by TradingView. Read more in the Terms of Use.