Hey friends, hope you are well and welcome to the new update on SushiSwap (SUSHI).
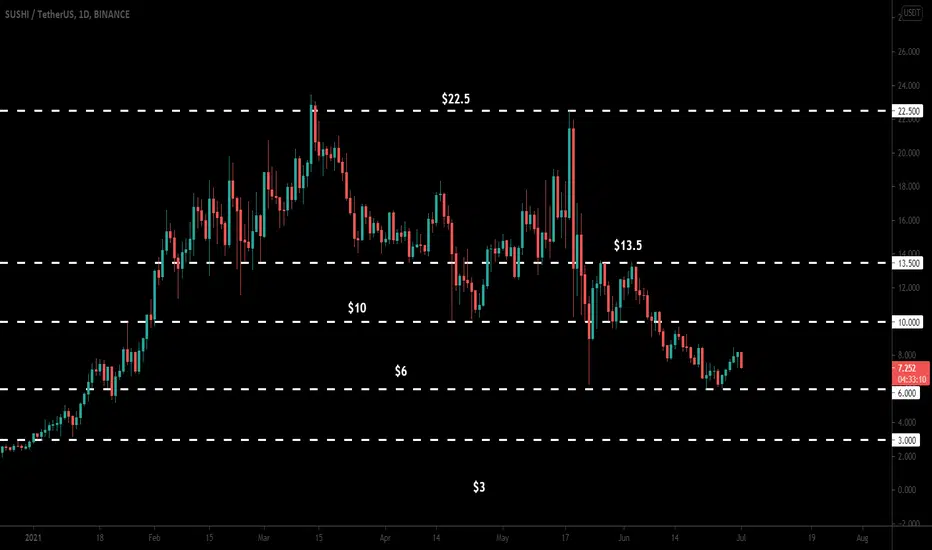
Different support and resistance levels:
Since November 2020 the price action of Sushi was very strong bullish. Finally, Sushi found the resistance at $22.5 and after being rejected to two times by this resistance level it has been dropped to $6 support level. Currently, the priceline is moving between the $6 support and the $10 resistance. After $10 we have resistance at 13.5 dollar then the final resistance is at 22.5 dollars.

The daily SMAs:
On the daily time frame chart, after the drop the price action has broken down the simple moving averages with the time period of 50,100 and 200. There is also a death cross formed above the price line that is putting more pressure to the price action. The100 simple moving average is also moving down to form a bear cross with 200 SMA. Therefore, we can expect that the price action of Sushi might break down the $6 support level.
Big bullish BAT pattern:
on the weekly time frame chart, the price action is very close to entering in the buying zone of a big bullish BAT pattern.
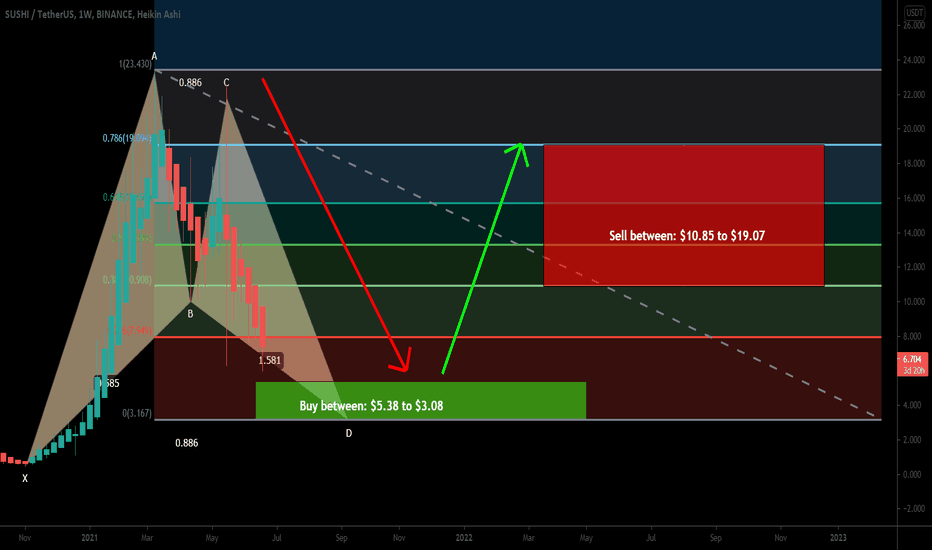
The buying and sell targets as per the Fibonacci sequence of this pattern are:
Buy between: $5.38 to $3.08
Sell between: $10.85 to $19.07
The maximum extent of the potential reversal zone $3.08 can be used as stop loss. As per the above targets, this trade has a huge profit possibility of 500%, and the a high loss possibility is 42%. Therefore try to buy it within the potential reversal zone as low as possible.
Conclusion:
There is a little more drop expected as the price action is completing the final leg of the bullish BAT pattern. The daily simple moving averages are also signaling to a bit more drop. However, once the bullish harmonic pattern will be completed the price action can turn very strong bullish and can make another attempt to break out that $22.5 and resistance level.
Different support and resistance levels:
Since November 2020 the price action of Sushi was very strong bullish. Finally, Sushi found the resistance at $22.5 and after being rejected to two times by this resistance level it has been dropped to $6 support level. Currently, the priceline is moving between the $6 support and the $10 resistance. After $10 we have resistance at 13.5 dollar then the final resistance is at 22.5 dollars.
The daily SMAs:
On the daily time frame chart, after the drop the price action has broken down the simple moving averages with the time period of 50,100 and 200. There is also a death cross formed above the price line that is putting more pressure to the price action. The100 simple moving average is also moving down to form a bear cross with 200 SMA. Therefore, we can expect that the price action of Sushi might break down the $6 support level.
Big bullish BAT pattern:
on the weekly time frame chart, the price action is very close to entering in the buying zone of a big bullish BAT pattern.
The buying and sell targets as per the Fibonacci sequence of this pattern are:
Buy between: $5.38 to $3.08
Sell between: $10.85 to $19.07
The maximum extent of the potential reversal zone $3.08 can be used as stop loss. As per the above targets, this trade has a huge profit possibility of 500%, and the a high loss possibility is 42%. Therefore try to buy it within the potential reversal zone as low as possible.
Conclusion:
There is a little more drop expected as the price action is completing the final leg of the bullish BAT pattern. The daily simple moving averages are also signaling to a bit more drop. However, once the bullish harmonic pattern will be completed the price action can turn very strong bullish and can make another attempt to break out that $22.5 and resistance level.
Disclaimer
The information and publications are not meant to be, and do not constitute, financial, investment, trading, or other types of advice or recommendations supplied or endorsed by TradingView. Read more in the Terms of Use.
Disclaimer
The information and publications are not meant to be, and do not constitute, financial, investment, trading, or other types of advice or recommendations supplied or endorsed by TradingView. Read more in the Terms of Use.