Detailed Chart Analysis: SUZLON ENERGY (Daily Timeframe)
Technical Observations:
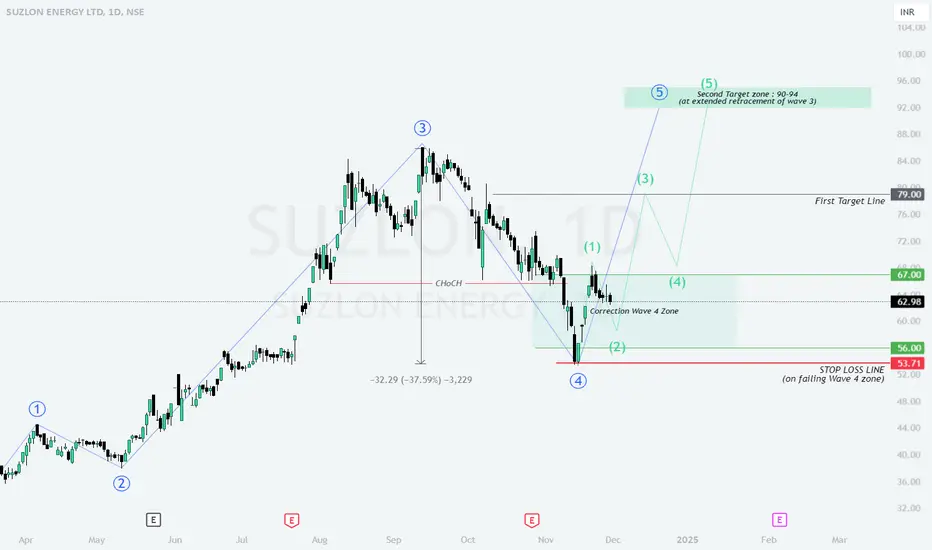
Pattern Identified: The stock is completing a Wave 4 correction in an Elliott Wave structure, consolidating between ₹56 - ₹67 (Fibonacci retracement zone).
Price Behavior: A bounce from this zone suggests the possibility of resuming the upward trend into Wave 5.
Buy Zone: ₹56 to ₹67 (Low-risk entry for a Wave 5 rally).
Targets:
Stop Loss: Below ₹53.71 (Placing it slightly below Wave 4 support zone).
Learning Points:
Wave 4 Correction: Often acts as a consolidation phase before the continuation of the broader trend.
Trend Continuation: A bounce from the Wave 4 zone confirms potential upside.
Risk Mitigation: A stop loss below ₹53.71 ensures controlled risk in case of failure.
Reason for Action:
Wave 4 Zone Validation: Consolidation around ₹56 signals accumulation and potential bullish breakout.
Target Rationale: Targets are aligned with Fibonacci projections for Wave 5.
Stop Loss Importance: It minimizes risk while allowing participation in the uptrend.
Disclaimer:
I am not a SEBI-registered analyst. All analyses are for educational purposes only. Please consult your financial advisor before making any trading or investment decisions.
Technical Observations:
Pattern Identified: The stock is completing a Wave 4 correction in an Elliott Wave structure, consolidating between ₹56 - ₹67 (Fibonacci retracement zone).
Price Behavior: A bounce from this zone suggests the possibility of resuming the upward trend into Wave 5.
Buy Zone: ₹56 to ₹67 (Low-risk entry for a Wave 5 rally).
Targets:
- []First Target: ₹79 (Aligned with prior swing highs and resistance levels).
[]Second Target: ₹90 - ₹94 (Based on Fibonacci projection for Wave 5).
Stop Loss: Below ₹53.71 (Placing it slightly below Wave 4 support zone).
Learning Points:
Wave 4 Correction: Often acts as a consolidation phase before the continuation of the broader trend.
Trend Continuation: A bounce from the Wave 4 zone confirms potential upside.
Risk Mitigation: A stop loss below ₹53.71 ensures controlled risk in case of failure.
Reason for Action:
Wave 4 Zone Validation: Consolidation around ₹56 signals accumulation and potential bullish breakout.
Target Rationale: Targets are aligned with Fibonacci projections for Wave 5.
Stop Loss Importance: It minimizes risk while allowing participation in the uptrend.
Disclaimer:
I am not a SEBI-registered analyst. All analyses are for educational purposes only. Please consult your financial advisor before making any trading or investment decisions.
Disclaimer
The information and publications are not meant to be, and do not constitute, financial, investment, trading, or other types of advice or recommendations supplied or endorsed by TradingView. Read more in the Terms of Use.
Disclaimer
The information and publications are not meant to be, and do not constitute, financial, investment, trading, or other types of advice or recommendations supplied or endorsed by TradingView. Read more in the Terms of Use.