Technical Overview
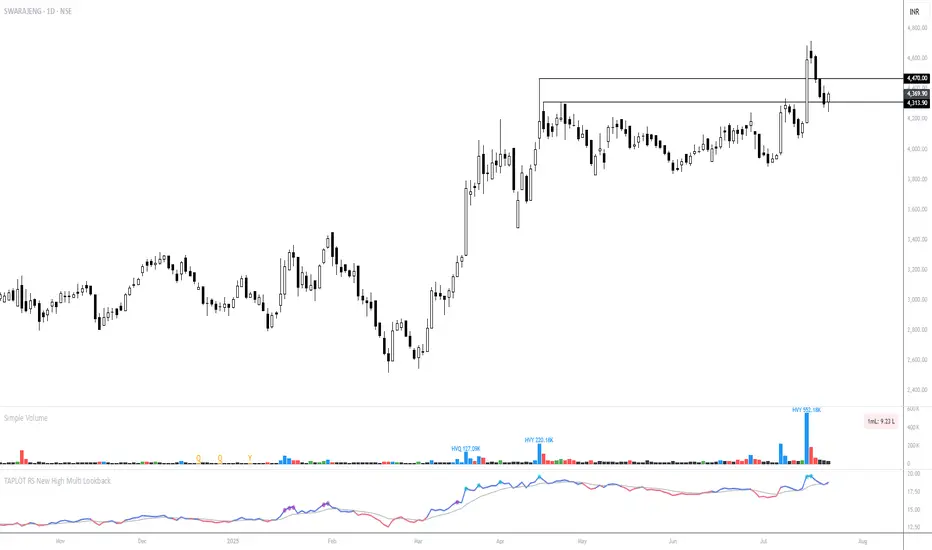
Trend: The chart shows a clear upward trend since early 2025. The price consolidated in a tight range for several months before breaking out convincingly.
Breakout: The breakout coincided with a notable spike in volume, indicating strong participation, likely due to robust earnings.
Current Price Action: After the breakout above the 4,313–4,350 resistance zone, the stock surged to fresh highs and is now pulling back, retesting the breakout zone as support.
Technical Setup
Support Levels:
4,350: Recent breakout level, now serving as immediate support.
4,313: Lower boundary of the support zone.
Resistance:
4,490 is the upper part of the breakout zone and the next resistance on upside moves.
Recent high (~4,700): Psychological and technical resistance.
Moving Averages: Price remains above the clustered short-term EMAs, supporting bullish sentiment.
Volume: Heavy buy volume on breakout; lighter volume during the pullback—suggesting selling pressure is mild so far.
Momentum (RSI/TA indicator): Still above the midline, positive but not overbought.
Action Plan
Bullish Scenario:
If price stabilizes and bounces off the 4,313–4,350 support zone—watch for bullish reversal candlesticks (e.g., hammer, bullish engulfing).
Entry: Consider long positions if the stock holds above 4,350 with a clear up-day and renewed volume.
Bearish Scenario:
If price breaks and closes below 4,313 on high volume, expect a deeper retracement (watch for next EMA or previous swing lows as possible supports).
Action: Consider tightening stops or reducing long exposure if the support fails.
Neutral/Wait-and-Watch:
If the price moves sideways or in a tight range near support, wait for clear resolution—either a decisive bounce or breakdown.
Disclaimer
The information and publications are not meant to be, and do not constitute, financial, investment, trading, or other types of advice or recommendations supplied or endorsed by TradingView. Read more in the Terms of Use.
Disclaimer
The information and publications are not meant to be, and do not constitute, financial, investment, trading, or other types of advice or recommendations supplied or endorsed by TradingView. Read more in the Terms of Use.