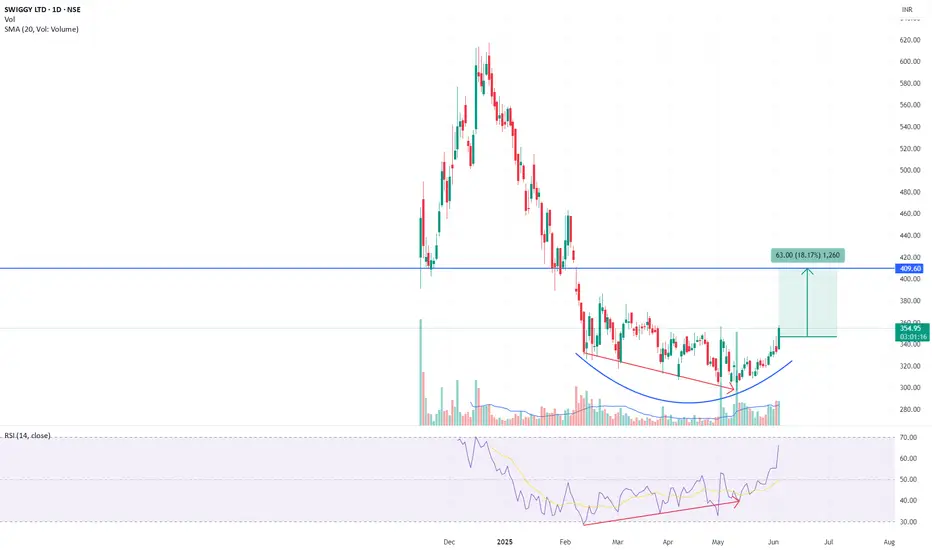
Pattern: Rounded bottom
Breakout level: ₹345
Current price: ₹355.55 (+6.71%)
Volume: 24.64M (above 20-day average of 20.91M)
RSI: 66.27 – strong bullish momentum
Target: ₹409 (18 percent upside)
Stop-loss: ₹324
Invalidation: Close below ₹340 with volume
Context:
A well-defined rounded base has broken out with strong follow-through. Volume exceeds the average, RSI confirms momentum, and the breakout candle shows no selling pressure. A bullish divergence in RSI had already signaled accumulation before price action confirmed it. Coverage initiation by Morgan Stanley aligns with, but does not drive, the technical breakout.
Disclaimer:
This analysis is intended for informational and educational purposes only and does not constitute financial, investment, or trading advice. Trading and investing in equities involve risk, including the risk of capital loss. The pattern recognition and breakout setup described here are based purely on technical chart analysis, without consideration of the company’s financial statements, earnings outlook, or valuation metrics. Market conditions can change rapidly, and price targets or stop-loss levels may not be respected under volatile scenarios. Always consult your financial advisor and conduct your own due diligence before making any investment decisions.
Note
SWIGGY is consolidating after a clean breakout from a rounded bottom base above ₹345. Post-breakout move hit ₹375+ before entering a low-volume pullback phase. Price is stabilizing above breakout zone with no signs of distribution. RSI cooled from overbought and is now flattening near 58, indicating momentum reset, not reversal.Structure remains bullish as long as ₹345 holds. Setup now resembles a base-on-base formation above prior resistance. A move above ₹365–₹368 with volume can resume momentum toward ₹409.
No change in thesis.
Note
SWIGGY is now trading at ₹391, less than 5% from our first target of ₹409. Price has followed through cleanly post-breakout, with a clear rounded bottom + base formation. Volume remains above average and RSI is firmly in bullish zone at \~71. Price action since breakout shows no signs of supply – pullbacks are shallow, and demand resurfaces near 20-DMA.A daily close above ₹392 may trigger final leg toward ₹409. Target remains unchanged. Trailing stop can be tightened to ₹379. Structure invalidated only below ₹365. Momentum remains intact.
Trade closed: target reached
Price hit the first target of ₹409 (18 percent gains) on opening, validating the rounded bottom breakout thesis. Volume remains elevated and RSI stays above 70, confirming momentum strength. Traders who followed the original setup may consider partial profit booking at this stage while trailing the rest. Next resistance seen near ₹435–₹440; full pattern target remains ₹459. Structure remains bullish above ₹387.Note
Still a bullish setup unless ₹377 breaks. Watch for a fresh close above ₹409 to resume uptrend toward ₹440 and ₹459. Continue trailing with ₹373–₹377 as hard stop. No new entry until breakout retest succeeds.Note
Higher highs and higher lows reinforced. Bullish continuation unless price closes below ₹387. ₹435–₹440 zone remains immediate hurdle. ₹459 still active.Disclaimer
The information and publications are not meant to be, and do not constitute, financial, investment, trading, or other types of advice or recommendations supplied or endorsed by TradingView. Read more in the Terms of Use.
Disclaimer
The information and publications are not meant to be, and do not constitute, financial, investment, trading, or other types of advice or recommendations supplied or endorsed by TradingView. Read more in the Terms of Use.