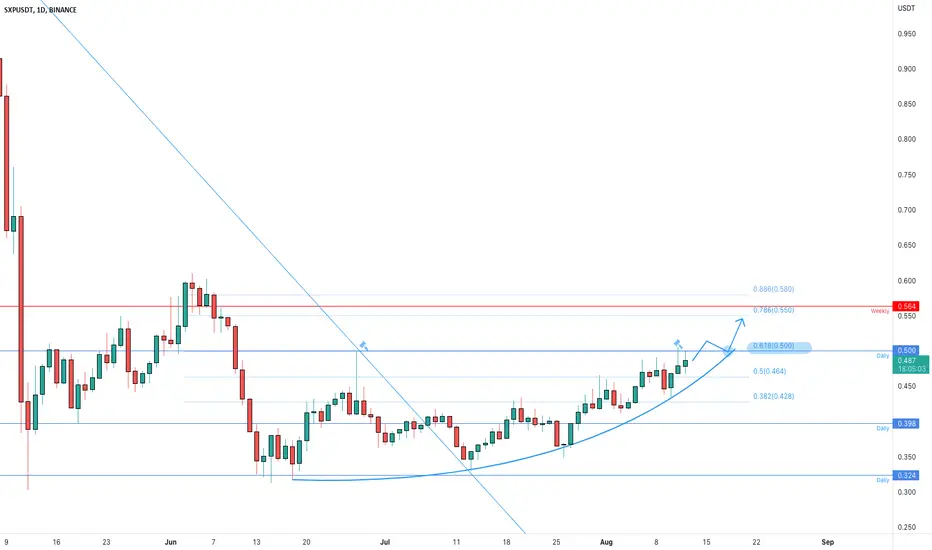
The price had a bounce exactly on our daily support at 0.324$ where the price created a double bottom as well.
After that, the price created a series of higher highs and higher lows, and now the market is testing a daily resistance at 0.5$ on the 0.618 Fibonacci level, it's a key level for the market.
How to approach it?
IF and only IF the price is going to have a breakout from that area and retest the current resistance as new support, According to Plancton's strategy, we can set a nice order
–––––
Keep in mind.
–––––
Follow the Shrimp 🦐
After that, the price created a series of higher highs and higher lows, and now the market is testing a daily resistance at 0.5$ on the 0.618 Fibonacci level, it's a key level for the market.
How to approach it?
IF and only IF the price is going to have a breakout from that area and retest the current resistance as new support, According to Plancton's strategy, we can set a nice order
–––––
Keep in mind.
- 🟣 Purple structure -> Monthly structure.
- 🔴 Red structure -> Weekly structure.
- 🔵 Blue structure -> Daily structure.
- 🟡 Yellow structure -> 4h structure.
–––––
Follow the Shrimp 🦐
Note
Wait for the clear breakout from the resistanceDisclaimer
The information and publications are not meant to be, and do not constitute, financial, investment, trading, or other types of advice or recommendations supplied or endorsed by TradingView. Read more in the Terms of Use.
Disclaimer
The information and publications are not meant to be, and do not constitute, financial, investment, trading, or other types of advice or recommendations supplied or endorsed by TradingView. Read more in the Terms of Use.