Hi Traders,
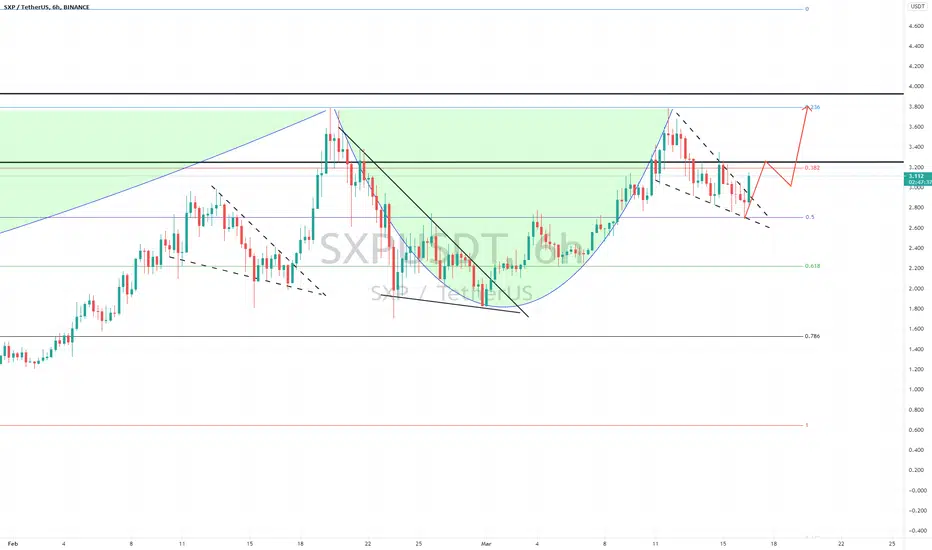
This is an odd chart but the shape fits, it might be just that.
If you look at the rest of the history of this, its even more puzzling.
If this ever brakes the top neckline, this could be a huge opportunity.

We have the daily and weekly resistance level above.
Phoeix indicator on the daily is still below 50%


All the best,
S.SAri.
This is an odd chart but the shape fits, it might be just that.
If you look at the rest of the history of this, its even more puzzling.
If this ever brakes the top neckline, this could be a huge opportunity.
We have the daily and weekly resistance level above.
Phoeix indicator on the daily is still below 50%
All the best,
S.SAri.
Note
The reason I bought in then looked at the macro after the buy. Pleasant surprise with a lot of potential.Note
Note
1/2 Dimond bottomDiscord: discord.com/invite/vb4hbP88vb (TradeToProspa)
Telegram: t.me/TprospaTradersbot
This community has signals now but with no risk management comms.
Telegram: t.me/TprospaTradersbot
This community has signals now but with no risk management comms.
Disclaimer
The information and publications are not meant to be, and do not constitute, financial, investment, trading, or other types of advice or recommendations supplied or endorsed by TradingView. Read more in the Terms of Use.
Discord: discord.com/invite/vb4hbP88vb (TradeToProspa)
Telegram: t.me/TprospaTradersbot
This community has signals now but with no risk management comms.
Telegram: t.me/TprospaTradersbot
This community has signals now but with no risk management comms.
Disclaimer
The information and publications are not meant to be, and do not constitute, financial, investment, trading, or other types of advice or recommendations supplied or endorsed by TradingView. Read more in the Terms of Use.