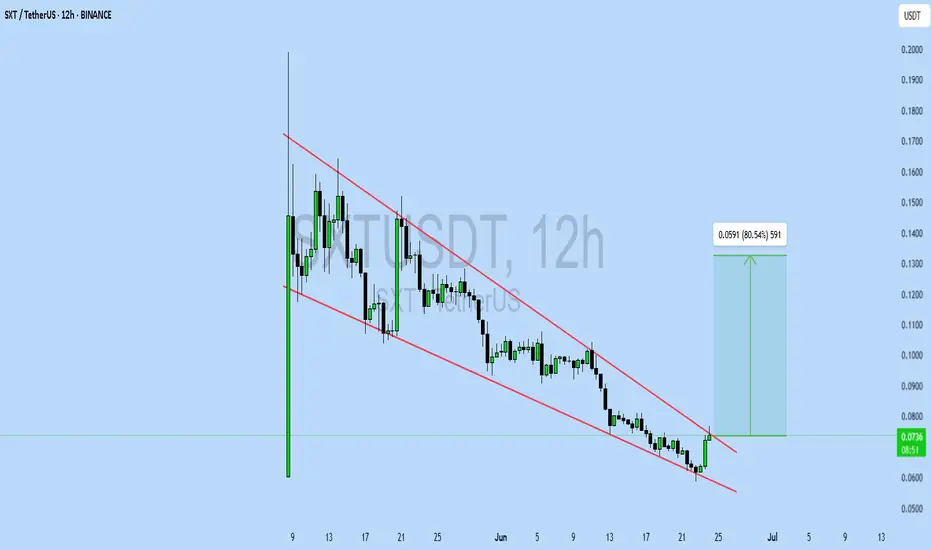
Pattern: Falling Wedge
Current Price: $0.0736
Target Price: $0.133
Target % Gain: 80.54%
Technical Analysis: SXT is forming a falling wedge on the 12H chart. The recent bullish breakout with increased momentum suggests potential upside. A sustained close above the wedge signals confirmation.
Time Frame: 12H
Current Price: $0.0736
Target Price: $0.133
Target % Gain: 80.54%
Technical Analysis: SXT is forming a falling wedge on the 12H chart. The recent bullish breakout with increased momentum suggests potential upside. A sustained close above the wedge signals confirmation.
Time Frame: 12H
🚀🔥Your gateway to expert crypto insights, signals & strategies! 📊💰
Join our Telegram for real-time market updates & profitable opportunities! 📈🔔
👇 Stay ahead in the crypto game 👇
👇👇👇👇👇👇
linktr.ee/CryptoWithJames
Join our Telegram for real-time market updates & profitable opportunities! 📈🔔
👇 Stay ahead in the crypto game 👇
👇👇👇👇👇👇
linktr.ee/CryptoWithJames
Disclaimer
The information and publications are not meant to be, and do not constitute, financial, investment, trading, or other types of advice or recommendations supplied or endorsed by TradingView. Read more in the Terms of Use.