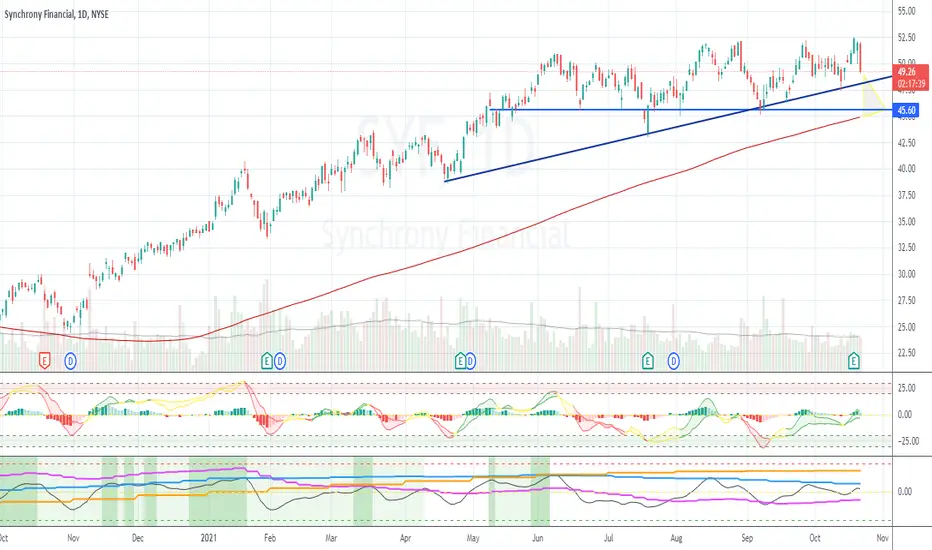
SYF should break below upward trend line and find support around the 200ma / horizontal support line.
Note
Testing the trendline break lower. I still have this and still like the chart.Trade closed manually
Sold for small profit. Bullish candle forming off support trend line. May re-enter later.Note
Just noticed SYF finally broke the downtrend this morning, down -4%. Need to work on letting trades play out more, without second guessing things.Disclaimer
The information and publications are not meant to be, and do not constitute, financial, investment, trading, or other types of advice or recommendations supplied or endorsed by TradingView. Read more in the Terms of Use.
Disclaimer
The information and publications are not meant to be, and do not constitute, financial, investment, trading, or other types of advice or recommendations supplied or endorsed by TradingView. Read more in the Terms of Use.