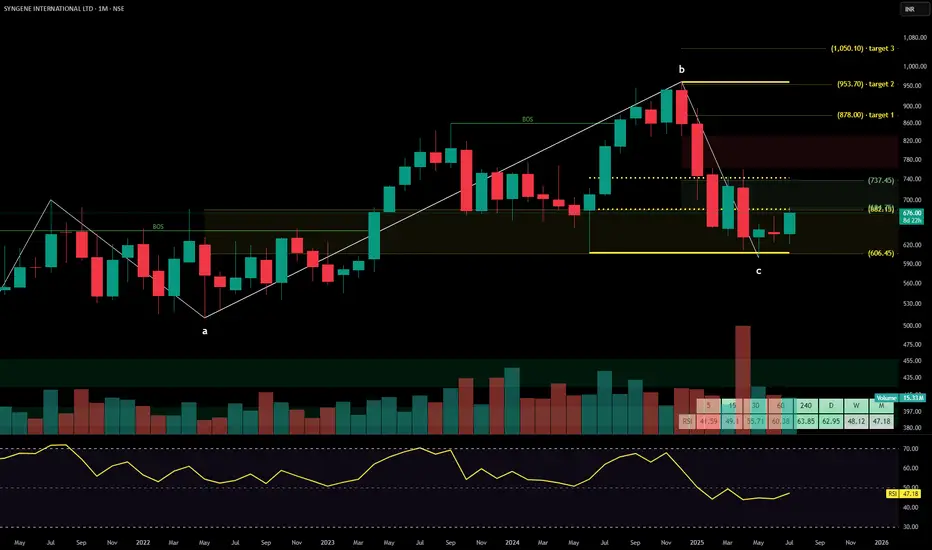
Syngene International Ltd. is a leading integrated research, development, and manufacturing services company, primarily serving global pharmaceutical, biotechnology, and agrochemical sectors. It offers discovery, development, and scale-up solutions under the contract research organization (CRO) and contract development and manufacturing organization (CDMO) models. The stock is currently trading at ₹676.00.
Syngene International Ltd. – FY22–FY25 Snapshot
Sales – ₹2,677 Cr → ₹3,135 Cr → ₹3,554 Cr → ₹3,964 Cr – Consistent topline growth driven by increased contracts Net Profit – ₹438 Cr → ₹514 Cr → ₹588 Cr → ₹667 Cr – Margins expanding with operational leverage in discovery and manufacturing services
Company Order Book – Moderate → Strong → Strong → Strong – High visibility from multiyear contracts
Dividend Yield (%) – 0.36% → 0.38% → 0.41% → 0.45% – Growing but modest payouts, prioritizing reinvestment Operating Performance – Moderate → Strong → Strong → Strong – Capacity utilization and cost control boosting
Equity Capital – ₹40.26 Cr (constant) – Stable capital structure
Total Debt – ₹325 Cr → ₹298 Cr → ₹270 Cr → ₹245 Cr – Gradual deleveraging in line with internal accruals
Total Liabilities – ₹1,310 Cr → ₹1,365 Cr → ₹1,430 Cr → ₹1,495 Cr – Stable expansion aligned with service delivery scale
Fixed Assets – ₹1,225 Cr → ₹1,280 Cr → ₹1,335 Cr → ₹1,390 Cr – Capex toward lab infra and cGMP manufacturing
Latest Highlights FY25 net profit rose 13.4% YoY to ₹667 Cr; revenue increased 11.5% to ₹3,964 Cr EPS: ₹16.57 | EBITDA Margin: 29.1% | Net Margin: 16.83% Return on Equity: 18.74% | Return on Assets: 12.94% Promoter holding: 54.36% | Dividend Yield: 0.45% Renewals from top pharma clients and expansion into ADC (antibody-drug conjugate) platforms Clinical trial support and molecule scale-up seeing higher global demand
Institutional Interest & Ownership Trends Promoter holding remains stable at 54.36%, with no pledging or dilution. FII participation has increased marginally post Q4 results, while domestic institutions maintain steady exposure. Delivery volumes indicate quiet accumulation from long-only funds with global CRO/CDMO themes.
Business Growth Verdict Yes, Syngene is scaling effectively across discovery and manufacturing services Margins are holding firm with diversified client and geography mix Debt reduction and capex efficiency indicate disciplined expansion High contract renewal rates and scientific capabilities boost visibility
Company Guidance Management expects FY26 growth to remain in low double digits, driven by molecule scale-ups and biologics manufacturing. Focus remains on increasing capacity utilization and expanding service depth across verticals.
Final Investment Verdict Syngene International Ltd. represents a durable compounder in India’s life sciences ecosystem. With strong partnerships, growing demand for outsourced research, and operational excellence, the company is positioned for long-term value creation. Its capital discipline, client stickiness, and technological depth make it attractive for accumulation by investors seeking exposure to high-margin, innovation-led pharma services.
Disclaimer
The information and publications are not meant to be, and do not constitute, financial, investment, trading, or other types of advice or recommendations supplied or endorsed by TradingView. Read more in the Terms of Use.
Disclaimer
The information and publications are not meant to be, and do not constitute, financial, investment, trading, or other types of advice or recommendations supplied or endorsed by TradingView. Read more in the Terms of Use.