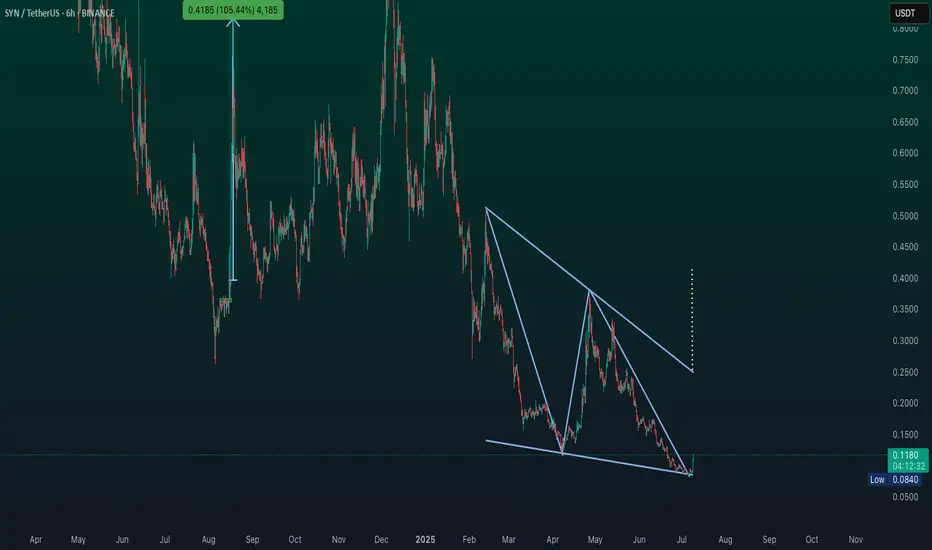
This 6H chart shows a drop from around 0.1138 to a low of 0.0840 recently, but it’s now up 23.8% in the last 24 hours due to a technical rebound, whale accumulation, and market-wide liquidity inflows—despite lingering delisting risks!
The tiny dip (-0.30%) today might just be a pause.
A falling wedge pattern is forming—could be a sign of more gains!
Crux:
Support Zone: A strong base is at 0.0900-0.1000, where buyers might step in.
Resistance Level: The next big test is at 0.1100-0.1138 break that, and it could rise!
Falling Wedge: This pattern, with its narrowing lines, often signals a bullish move if it breaks above 0.1138.
Momentum: The uptrend has steady volume, boosted by whale activity and liquidity inflows, though delisting risks linger
Timeframe:Watch the next few days for the wedge to break out
Possibilities:Bullish Move: A jump above 0.1138 with good volume could push it to 0.1300 or more
Bearish Drop: A fall below 0.0900 might take it back to 0.0840—stay careful!
Safety Tip: Set a stop-loss below 0.0900 to stay safe.
Disclaimer
The information and publications are not meant to be, and do not constitute, financial, investment, trading, or other types of advice or recommendations supplied or endorsed by TradingView. Read more in the Terms of Use.
Disclaimer
The information and publications are not meant to be, and do not constitute, financial, investment, trading, or other types of advice or recommendations supplied or endorsed by TradingView. Read more in the Terms of Use.