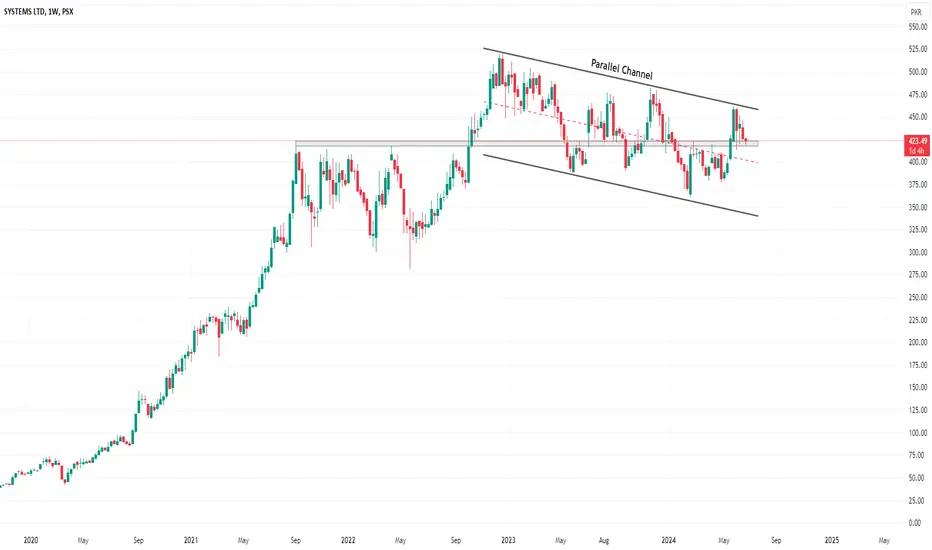
There are two possible scenarios in SYS technical chart, either it follows parallel channel or pull back from its current support level.
Note
SYS facing resistance around 458Trade active
break out of parallel channel is observed, weekly closing must be above the channel for any bullish momentum.Note
After the observed breakout on the SYS technical chart, a flag pattern appears to be forming. A breakout above its previous peak of 520 is required, with a projected flag target around 565.Trade active
Flag projection lies around 565Disclaimer
The information and publications are not meant to be, and do not constitute, financial, investment, trading, or other types of advice or recommendations supplied or endorsed by TradingView. Read more in the Terms of Use.
Disclaimer
The information and publications are not meant to be, and do not constitute, financial, investment, trading, or other types of advice or recommendations supplied or endorsed by TradingView. Read more in the Terms of Use.