Many charts are currently looking the same in Crypto.
Look at SYS for example. breakout from a falling wedge, spike in volume.
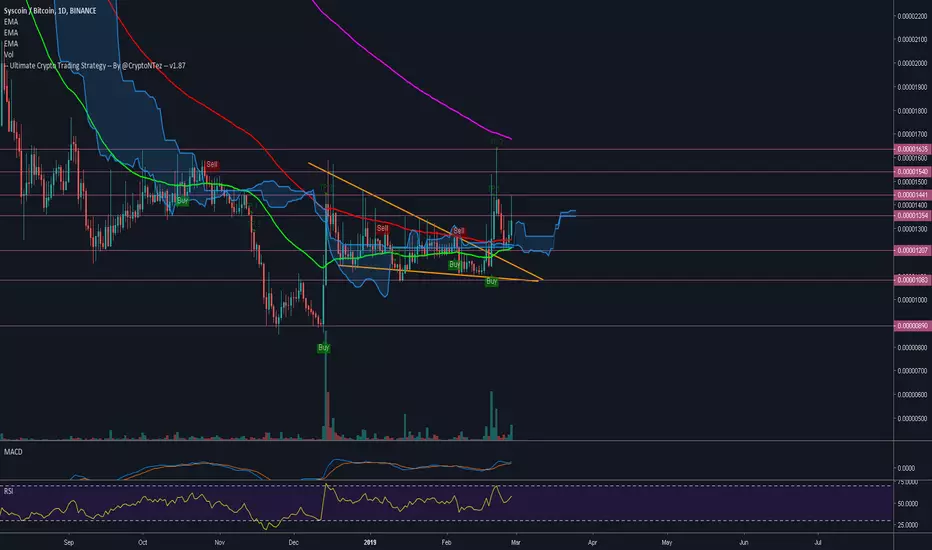
Then pullback, retest of EMA50 and push with volume again. I'm seeing this pattern a lot around my TA... Try to find the ones that are lagging #SYS
Look at
Then pullback, retest of EMA50 and push with volume again. I'm seeing this pattern a lot around my TA... Try to find the ones that are lagging #SYS
Trade active
Update on Volume really low
ABCD bearish pattern showing a Potential pullback
MACD & RSI flat
UCTS Buy signal on 1D
While the ascending trendline keeps holding, we can aim for higher targets BUT volume is needed. If it fails to hodl, a retest /EMA50 may happen
#SYS
UCTS Indicator? Get a 10 days FREE trial at Cryptontez.com
Improve your Crypto Trading with 3commas. 3commas.io/?c=Cryptontez
Telegram Group: t.me/CryptontezTA
Improve your Crypto Trading with 3commas. 3commas.io/?c=Cryptontez
Telegram Group: t.me/CryptontezTA
Disclaimer
The information and publications are not meant to be, and do not constitute, financial, investment, trading, or other types of advice or recommendations supplied or endorsed by TradingView. Read more in the Terms of Use.