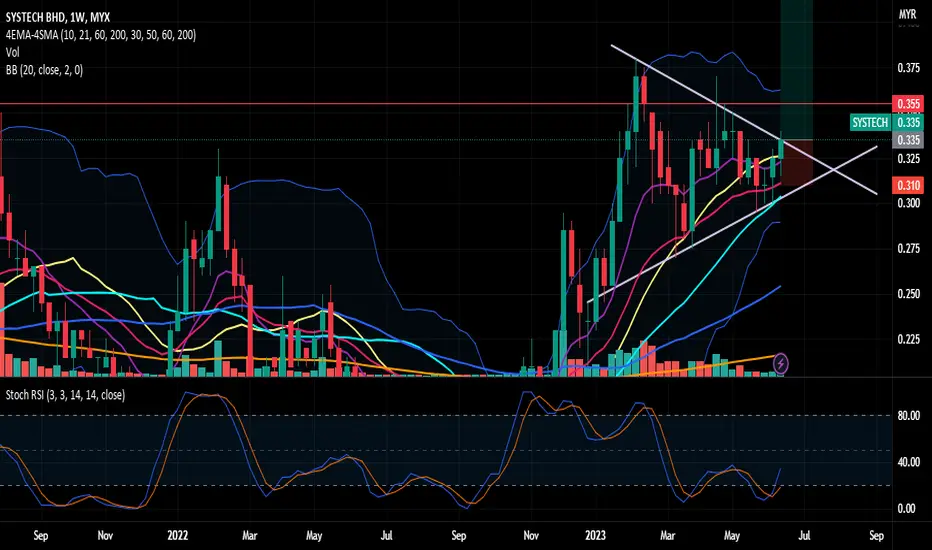
Based on weekly chart, it looks like Systech forming a triangle pattern. Moreover, the price closed above last week closing price with the indicator shows a signal rebounding from oversold region. In addition, the stock forming a bullish engulfing pattern on daily chart.
Disclaimer
The information and publications are not meant to be, and do not constitute, financial, investment, trading, or other types of advice or recommendations supplied or endorsed by TradingView. Read more in the Terms of Use.
Disclaimer
The information and publications are not meant to be, and do not constitute, financial, investment, trading, or other types of advice or recommendations supplied or endorsed by TradingView. Read more in the Terms of Use.