Past SPX action after the 10y-2y yield inversion unwound
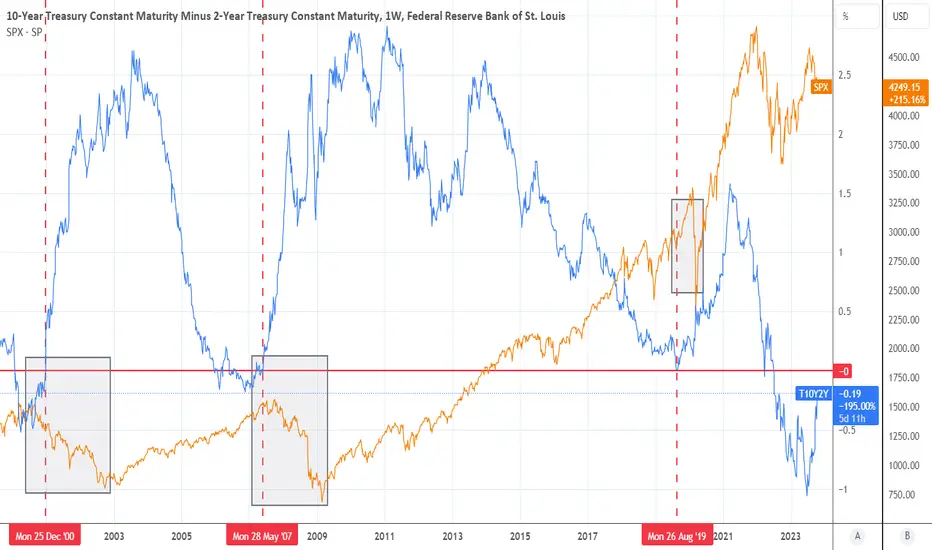
I made a chart to show past SPX action after the 10y-2y yield inversion unwound.
Dec 2000: SPX was already in bear market and continued down.
May 2007: SPX topped, then made a double top, then collapsed.
Aug 2019 (atypical): SPX made a +10% move, then collapsed.
Dec 2000: SPX was already in bear market and continued down.
May 2007: SPX topped, then made a double top, then collapsed.
Aug 2019 (atypical): SPX made a +10% move, then collapsed.
Disclaimer
The information and publications are not meant to be, and do not constitute, financial, investment, trading, or other types of advice or recommendations supplied or endorsed by TradingView. Read more in the Terms of Use.
Disclaimer
The information and publications are not meant to be, and do not constitute, financial, investment, trading, or other types of advice or recommendations supplied or endorsed by TradingView. Read more in the Terms of Use.