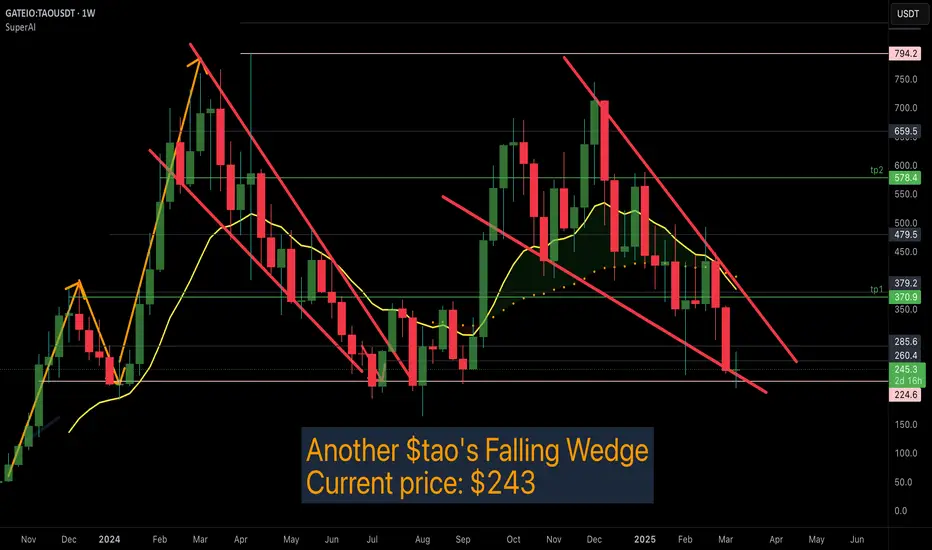
Current price: $243
For everytime #Tao has formed these falling wedges with Key support around 224, It has been accompanied by an explosive move upwards.
#Tao has also lost over 70% of it's value from an all time high of 795. So it is low risk.
Expecting retest of these supports: 370, 578
This idea Invalidation under 224!
More Extensive Analysis:
This chart is showing the price action of
1. Falling Wedge Pattern
- The chart highlights a falling wedge pattern, characterized by converging downward-sloping trendlines.
- Falling wedges are typically bullish reversal patterns, meaning a potential breakout to the upside could occur.
- The previous falling wedge led to a strong rally, suggesting a similar scenario might unfold.
2. Current Price & Key Levels
Current Price: $243
Support Levels:
Most recent low $224
Resistance Levels:
$260 - $285** (near-term resistance)
$370 - $380 (tp1 - Take Profit 1)**
$578 - $600 (tp2 - Take Profit 2)**
$794 (long-term resistance)**
3. Key Takeaways & Trade Outlook*
- If the price breaks out above the falling wedge, a bullish move toward $370+ is possible.
- If the price breaks down further, the next major support is around $224.
- Traders might look for **confirmation** of the breakout before entering long positions.
Note
Trade active
Note
370 incoming? Related publications
Disclaimer
The information and publications are not meant to be, and do not constitute, financial, investment, trading, or other types of advice or recommendations supplied or endorsed by TradingView. Read more in the Terms of Use.
Related publications
Disclaimer
The information and publications are not meant to be, and do not constitute, financial, investment, trading, or other types of advice or recommendations supplied or endorsed by TradingView. Read more in the Terms of Use.