🔎 Market Overview
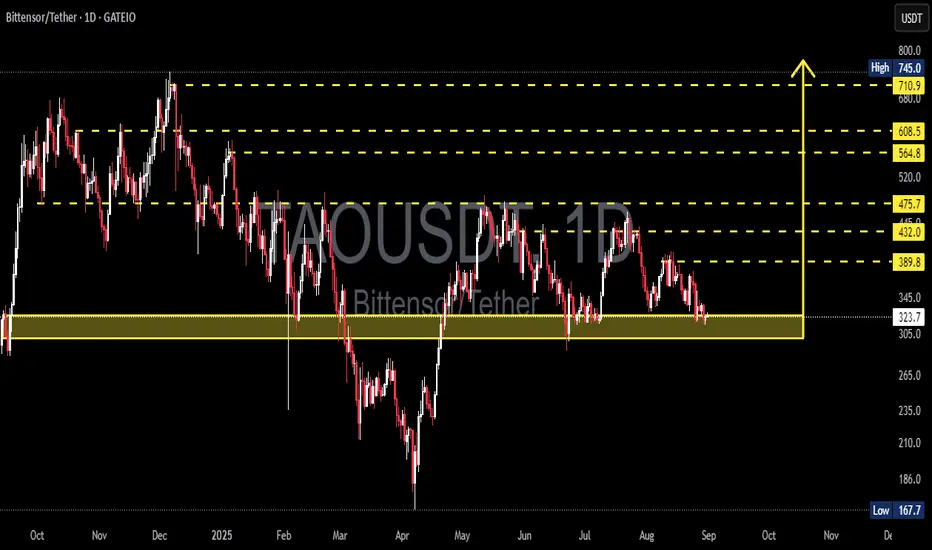
TAO/USDT is currently trading around 324 USDT, sitting right inside the key demand zone (305–345) that has been tested multiple times since late 2024. This area has repeatedly acted as a strong defensive wall for buyers, and once again the market is waiting for a big decision: bounce or breakdown.
From April to August 2025, the chart shows a series of lower highs, reflecting continued selling pressure. However, the repeated defense of this demand zone suggests accumulation is possible if a strong bullish reaction appears.
---
🧩 Price Structure & Pattern
Current pattern: Consolidation within the demand zone (305–345).
Key characteristics:
Buyers have successfully defended this level multiple times → potential accumulation area.
Larger structure still shows minor downtrend (lower highs).
A confirmed breakdown could trigger deeper sell-offs.
In short, this is the battle zone between bulls and bears that will determine the medium-term direction.
---
📈 Bullish Scenario
If price holds and bounces from the demand zone:
Confirmation: Daily bullish candle closing above 345–350 with strong volume.
Upside targets:
🎯 TP1: 389.8 (first resistance & short-term supply zone)
🎯 TP2: 432.0 (mid-term supply zone)
🎯 TP3: 475.7 (major resistance – key to shift medium-term trend)
🎯 Extensions: 564.8 – 608.5 – 710.9 – 745.0
➡️ A successful bounce could form a double bottom / base formation.
---
📉 Bearish Scenario
If price fails to hold the demand zone (daily close below 305):
Confirmation: Breakdown candle with strong volume + failed retest.
Downside targets:
🎯 265 – 235 (nearest supports)
🎯 167.7 (historical low – potential final target if strong selling pressure continues)
➡️ This would form a major support breakdown, potentially triggering a larger distribution phase.
---
⚖️ Technical Conclusion
Current bias: Neutral to Bearish – downtrend structure remains, but bulls are still defending.
305–345 is the make-or-break zone.
Bounce → potential rally towards 389–475.
Breakdown → possible drop to 235 or even 167.
---
🛡️ Risk Management Notes
Clear stop-loss levels:
Bullish setup: SL below 305.
Bearish setup: SL above 345–350 after breakdown.
Scale into positions rather than going all-in.
Watch for volume confirmation & momentum indicators (RSI/MACD) to avoid false breakouts.
---
📌 Extra Insights
The 305–345 zone is not only a technical level but also a psychological price floor, tested multiple times.
The structure of lower highs vs. strong support often resolves with a major breakout — meaning the next move could be very aggressive.
Patience is key: traders should wait for a clear daily close confirmation before entering to avoid being trapped in a fake move.
#TAO #Bittensor #TAOUSDT #CryptoAnalysis #TechnicalAnalysis #SupportResistance #Breakout #CryptoTrading #SwingTrading #PriceAction
✅ Get Free Signals! Join Our Telegram Channel Here: t.me/TheCryptoNuclear
✅ Twitter: twitter.com/crypto_nuclear
✅ Join Bybit : partner.bybit.com/b/nuclearvip
✅ Benefits : Lifetime Trading Fee Discount -50%
✅ Twitter: twitter.com/crypto_nuclear
✅ Join Bybit : partner.bybit.com/b/nuclearvip
✅ Benefits : Lifetime Trading Fee Discount -50%
Disclaimer
The information and publications are not meant to be, and do not constitute, financial, investment, trading, or other types of advice or recommendations supplied or endorsed by TradingView. Read more in the Terms of Use.