This idea focuses on the Saudi Stock Market (TASI) key support and resistance levels based on time-sequenced price action.
Current support zone is highlighted (Point 1).
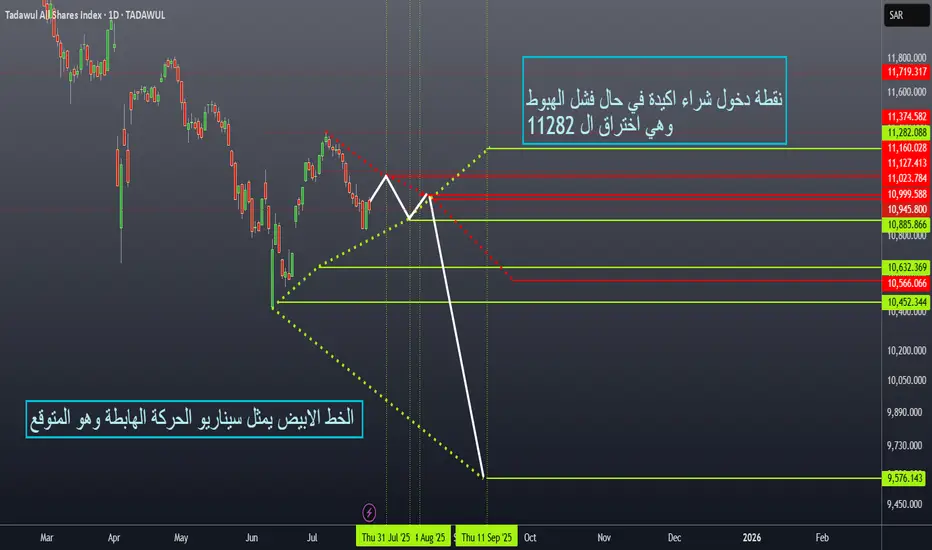
Time-based sequence:
🔺 Resistance on July 31 at 11126
🟢 Support on August 11 at 10885
🔺 Resistance on August 14 at 10999 / 10945
🟢 Support on September 1 at 9576
Connecting these points reveals the expected scenario shown in the second chart.
Key level: 11282 (Point 3) – A confirmed breakout above this level signals a strong buy opportunity, as it:
✔ Acts as a major support
✔ Breaks the descending channel
✔ Invalidates the bearish continuation scenario
📈 Watching for a bullish breakout above 11282 to enter long positions.
Current support zone is highlighted (Point 1).
Time-based sequence:
🔺 Resistance on July 31 at 11126
🟢 Support on August 11 at 10885
🔺 Resistance on August 14 at 10999 / 10945
🟢 Support on September 1 at 9576
Connecting these points reveals the expected scenario shown in the second chart.
Key level: 11282 (Point 3) – A confirmed breakout above this level signals a strong buy opportunity, as it:
✔ Acts as a major support
✔ Breaks the descending channel
✔ Invalidates the bearish continuation scenario
📈 Watching for a bullish breakout above 11282 to enter long positions.
Disclaimer
The information and publications are not meant to be, and do not constitute, financial, investment, trading, or other types of advice or recommendations supplied or endorsed by TradingView. Read more in the Terms of Use.
Disclaimer
The information and publications are not meant to be, and do not constitute, financial, investment, trading, or other types of advice or recommendations supplied or endorsed by TradingView. Read more in the Terms of Use.