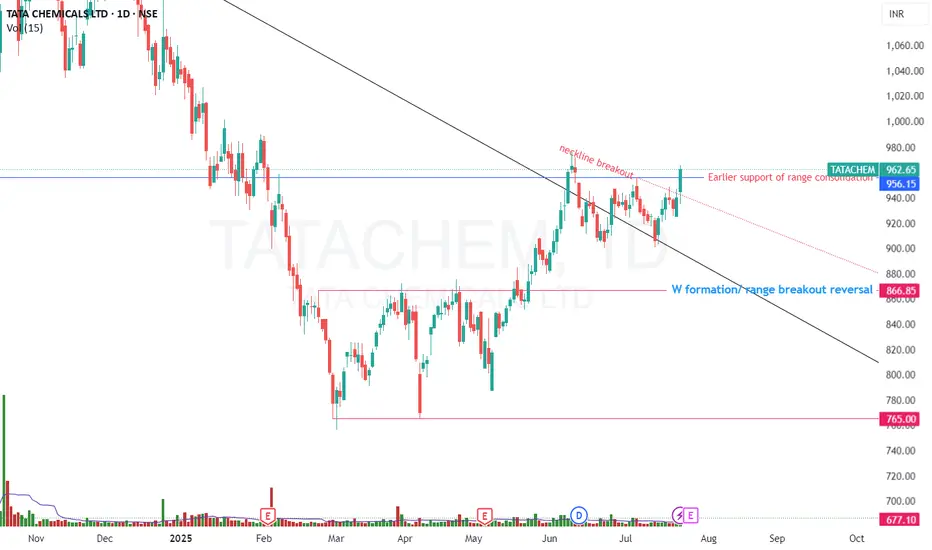
📉 Trend Reversal from ₹790–₹800 Support Zone
'W' pattern formed on daily chart — trend reversal signal.
Bottom range & neckline breakout confirm bullish momentum.
Price consolidating above W base, showing strength.
📈 Bias: Bullish above neckline; potential for further upside.
🗓️ Upcoming Event: Q1 results due soon — may act as a trigger for next move.
⚠️ Risk: Breakdown below ₹890 could negate the setup CMP = 962.65 total 70 points nearly 7% SL.
Disclaimer
The information and publications are not meant to be, and do not constitute, financial, investment, trading, or other types of advice or recommendations supplied or endorsed by TradingView. Read more in the Terms of Use.
Disclaimer
The information and publications are not meant to be, and do not constitute, financial, investment, trading, or other types of advice or recommendations supplied or endorsed by TradingView. Read more in the Terms of Use.