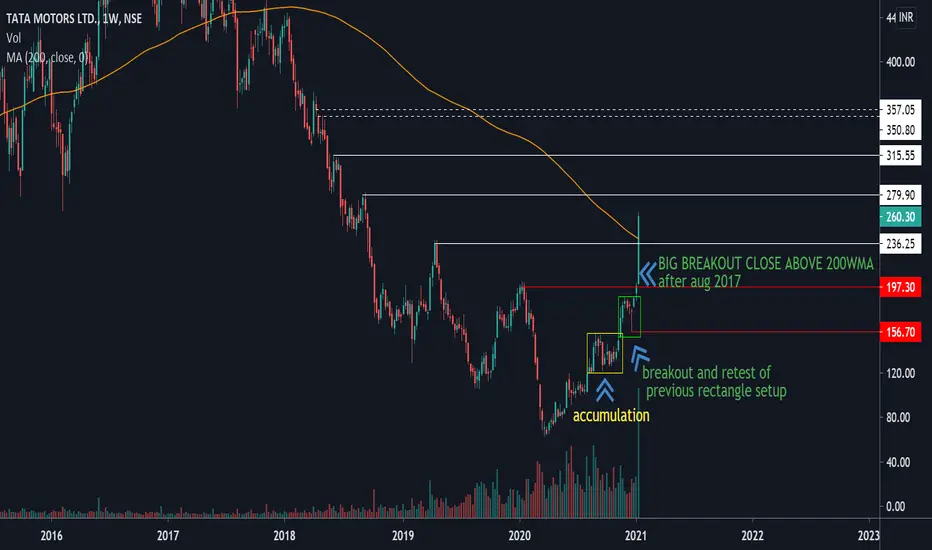
TATA MOTORS after 2017 crossed 200WMA
the volume is huge w.r.t previous week
this chart is clear example of price action volume
First rectangle : Accumulation
Second rectangle : small breakout retest and again accumulation
then big breakout with huge volume
we can not predict intensity of breakout but closely if we follow
price action we can read movements in the charts and accumulate for large moves
Disclaimer
The information and publications are not meant to be, and do not constitute, financial, investment, trading, or other types of advice or recommendations supplied or endorsed by TradingView. Read more in the Terms of Use.
Disclaimer
The information and publications are not meant to be, and do not constitute, financial, investment, trading, or other types of advice or recommendations supplied or endorsed by TradingView. Read more in the Terms of Use.