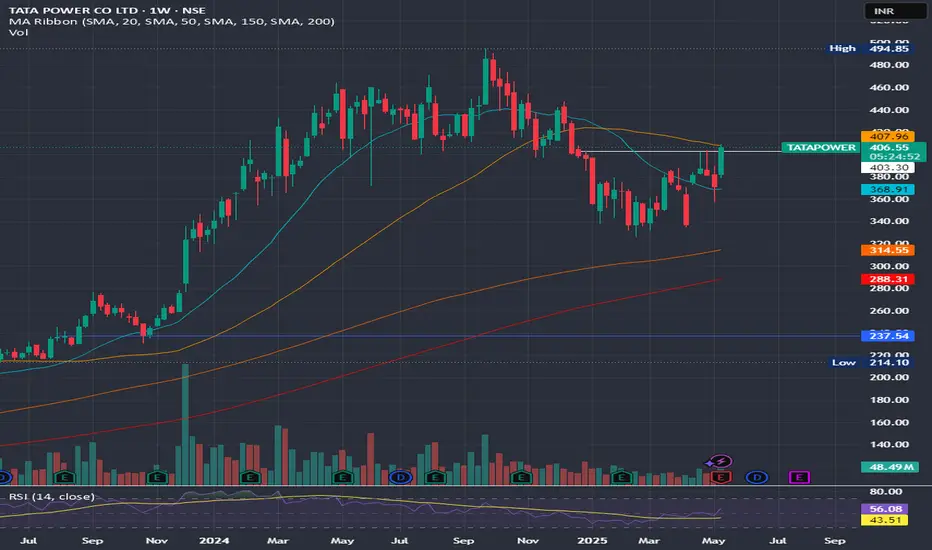
Tata Power's technical indicators suggest a strong buy signal based on moving averages and oscillators. Here’s a quick breakdown:
- Relative Strength Index (RSI): 65.04 (indicating bullish momentum)
- MACD: 3.38 (positive crossover, signaling upward trend)
- Moving Averages: All major SMAs and EMAs indicate a buy
- Pivot Points: Key support at ₹388.64, resistance at ₹398.69
Close Above 400 mark will be positive
- Short-Term Forecast: Technical analysis suggests support around ₹390 and resistance near ₹626, with a potential price target of ₹417.23 in the next two weeks.
Disclaimer
The information and publications are not meant to be, and do not constitute, financial, investment, trading, or other types of advice or recommendations supplied or endorsed by TradingView. Read more in the Terms of Use.
Disclaimer
The information and publications are not meant to be, and do not constitute, financial, investment, trading, or other types of advice or recommendations supplied or endorsed by TradingView. Read more in the Terms of Use.