Trade Setup
📌 Stock: TATA TECHNOLOGIES ( TATATECH )
📌 Trend: Strong Bullish Momentum
📌 Risk-Reward Ratio: 1:3 (Favorable)
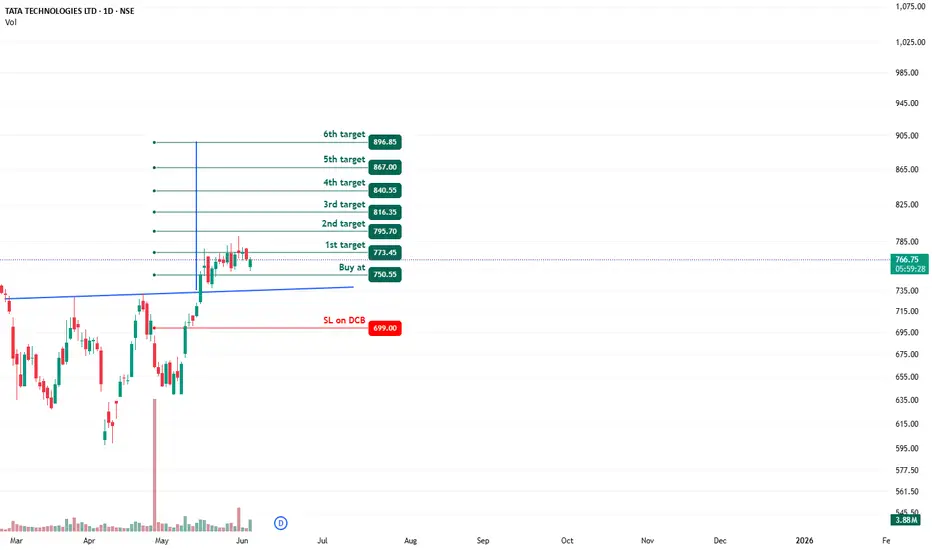
🎯 Entry Zone: ₹750.55(Breakout Confirmation)
🛑 Stop Loss: ₹699.00(Daily Closing Basis) (~5.6% Risk)
🎯 Target Levels:
₹773.45
₹795.70
₹816.35
₹840.55
₹867.00
₹896.85 (Final Target)
Technical Rationale
✅ Bullish Inverted Head & Shoulder Breakout - Classic bullish pattern confirming uptrend continuation
✅ Strong Momentum - Daily RSI >60 & Weekly RSI >50
✅ Volume Confirmation - Breakout volume 3.43M(while posting) vs previous day's 767.40K (Nearly 5x surge while posting)
✅ Multi-Timeframe Alignment - Daily and weekly charts showing strength
Key Observations
• The breakout comes with significantly higher volume, validating strength
• Well-defined pattern with clear price & volume breakout
• Conservative stop loss at recent swing low
Trade Management Strategy
• Consider partial profit booking at each target level
• Move stop loss to breakeven after Target 1 is achieved
• Trail stop loss to protect profits as price progresses
Disclaimer ⚠️
This analysis is strictly for educational purposes and should not be construed as financial advice. Trading in equities involves substantial risk of capital loss. Past performance is not indicative of future results. Always conduct your own research, consider your risk appetite, and consult a financial advisor before making any investment decisions. The author assumes no responsibility for any trading outcomes based on this information.
What do you think? Are you watchingTATATECH for this breakout opportunity? Share your views in the comments!
📌 Stock: TATA TECHNOLOGIES (
📌 Trend: Strong Bullish Momentum
📌 Risk-Reward Ratio: 1:3 (Favorable)
🎯 Entry Zone: ₹750.55(Breakout Confirmation)
🛑 Stop Loss: ₹699.00(Daily Closing Basis) (~5.6% Risk)
🎯 Target Levels:
₹773.45
₹795.70
₹816.35
₹840.55
₹867.00
₹896.85 (Final Target)
Technical Rationale
✅ Bullish Inverted Head & Shoulder Breakout - Classic bullish pattern confirming uptrend continuation
✅ Strong Momentum - Daily RSI >60 & Weekly RSI >50
✅ Volume Confirmation - Breakout volume 3.43M(while posting) vs previous day's 767.40K (Nearly 5x surge while posting)
✅ Multi-Timeframe Alignment - Daily and weekly charts showing strength
Key Observations
• The breakout comes with significantly higher volume, validating strength
• Well-defined pattern with clear price & volume breakout
• Conservative stop loss at recent swing low
Trade Management Strategy
• Consider partial profit booking at each target level
• Move stop loss to breakeven after Target 1 is achieved
• Trail stop loss to protect profits as price progresses
Disclaimer ⚠️
This analysis is strictly for educational purposes and should not be construed as financial advice. Trading in equities involves substantial risk of capital loss. Past performance is not indicative of future results. Always conduct your own research, consider your risk appetite, and consult a financial advisor before making any investment decisions. The author assumes no responsibility for any trading outcomes based on this information.
What do you think? Are you watching
Disclaimer
The information and publications are not meant to be, and do not constitute, financial, investment, trading, or other types of advice or recommendations supplied or endorsed by TradingView. Read more in the Terms of Use.
Disclaimer
The information and publications are not meant to be, and do not constitute, financial, investment, trading, or other types of advice or recommendations supplied or endorsed by TradingView. Read more in the Terms of Use.