Technical Analysis of Tribhovandas Bhimji Zaveri (TBZ) - As per current chart pattern and previous chart history suggests strong buy in this stock. Also As per technical analysis of this stock indicates a strong bullish momentum and ready to explode after a short correction
NOTE:- This stock is Consolidating since 9-Feb-2024 in H1,H4 and Daily time frames
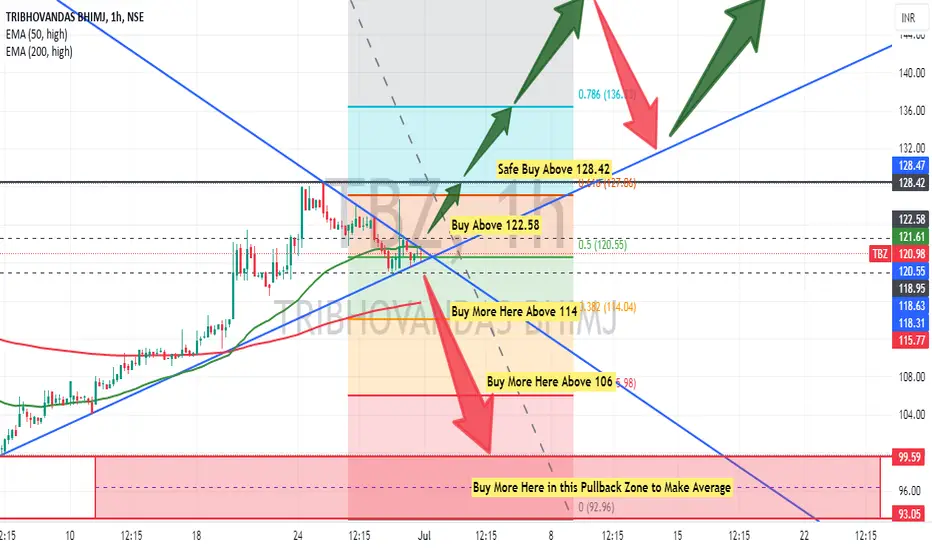
Also in H1 time frame it is trading in a symmetrical triangle and you can buy if it breaks upside and retest the nearest support after breakout. But if it breaks downside the triangle then you can wait till the retest of the nearest support.
Safe Buy Above 128.47
Nearest Support 113
Major Support Zone is 93-99.59 (Also a Pullback Zone)
Overall, recent technical analysis suggests a bullish trend for TBZ. Here's a breakdown of some key indicators:
Moving Averages: The moving averages for TBZ as a strong buy signal
Bullish Flag Breakout: It is showing a bullish flag breakout on the daily charts, indicating a potential rise in price
RSI and Stochastic: The Relative Strength Index (RSI) is positive and the Slow Stochastic is nearing overbought territory, suggesting strong momentum but possible need for a short-term correction
Volume: Recent breakouts were accompanied by good volume, which is a positive sign
Here are some additional points to consider:
Thanks for your support as always
Disclaimer: This information is for educational purposes only and should not be considered financial advice. Please consult with a qualified financial advisor before making any investment decisions.
NOTE:- This stock is Consolidating since 9-Feb-2024 in H1,H4 and Daily time frames
Also in H1 time frame it is trading in a symmetrical triangle and you can buy if it breaks upside and retest the nearest support after breakout. But if it breaks downside the triangle then you can wait till the retest of the nearest support.
Safe Buy Above 128.47
Nearest Support 113
Major Support Zone is 93-99.59 (Also a Pullback Zone)
Overall, recent technical analysis suggests a bullish trend for TBZ. Here's a breakdown of some key indicators:
Moving Averages: The moving averages for TBZ as a strong buy signal
Bullish Flag Breakout: It is showing a bullish flag breakout on the daily charts, indicating a potential rise in price
RSI and Stochastic: The Relative Strength Index (RSI) is positive and the Slow Stochastic is nearing overbought territory, suggesting strong momentum but possible need for a short-term correction
Volume: Recent breakouts were accompanied by good volume, which is a positive sign
Here are some additional points to consider:
- Technical analysis should be used in conjunction with fundamental analysis for a more comprehensive understanding of the stock's potential.
- The overbought signals from RSI and Stochastic shouldn't be ignored completely, and a short-term pullback is a possibility.
- Always set stop-loss orders to manage risk if you are an Intraday Trader to avoid major loss
Thanks for your support as always
Disclaimer: This information is for educational purposes only and should not be considered financial advice. Please consult with a qualified financial advisor before making any investment decisions.
Disclaimer
The information and publications are not meant to be, and do not constitute, financial, investment, trading, or other types of advice or recommendations supplied or endorsed by TradingView. Read more in the Terms of Use.
Disclaimer
The information and publications are not meant to be, and do not constitute, financial, investment, trading, or other types of advice or recommendations supplied or endorsed by TradingView. Read more in the Terms of Use.