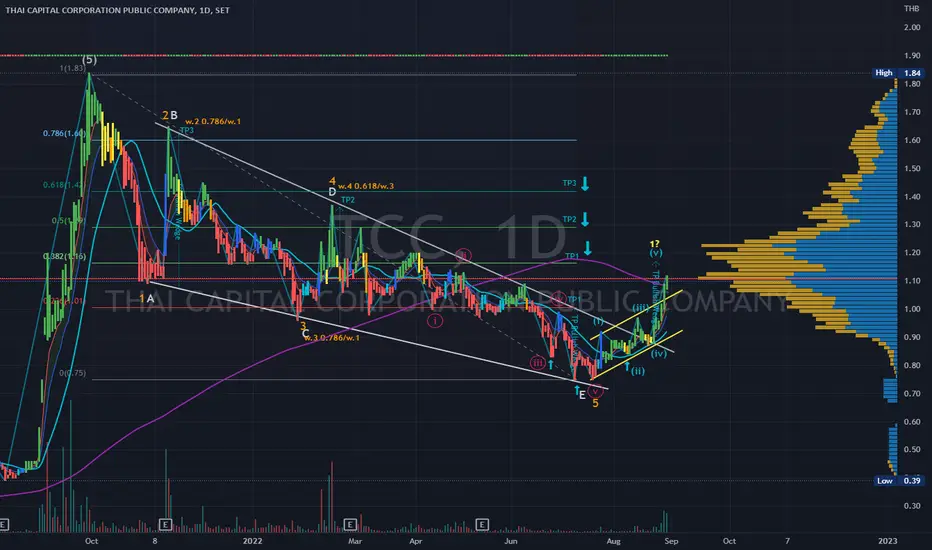
Elliott Wave Projection - Price action and chart pattern trading
> Bullish Wedge Elliott Wave downtrend channel breakout
> Key resistance SMA200
> TP1 @ 0.382 retracement of previous wave 5 - volume profile point of control zone equal to distance of wave E to the falling wedge breakout point
> TP2 @ 0.5 retracement - upper resistance of key volume profile zone = distance of wave C > D from breakout point
> TP3 @ 0.618 retracement - equal to the distance of A>B +30%
> Entry @ Pullback SMA200 zone
> Stoploss @ SMA20 zone -10%+
> Risk reward ratio: 3:1
Always trade with affordable risk and respect your stoploss
Disclaimer
The information and publications are not meant to be, and do not constitute, financial, investment, trading, or other types of advice or recommendations supplied or endorsed by TradingView. Read more in the Terms of Use.
Disclaimer
The information and publications are not meant to be, and do not constitute, financial, investment, trading, or other types of advice or recommendations supplied or endorsed by TradingView. Read more in the Terms of Use.