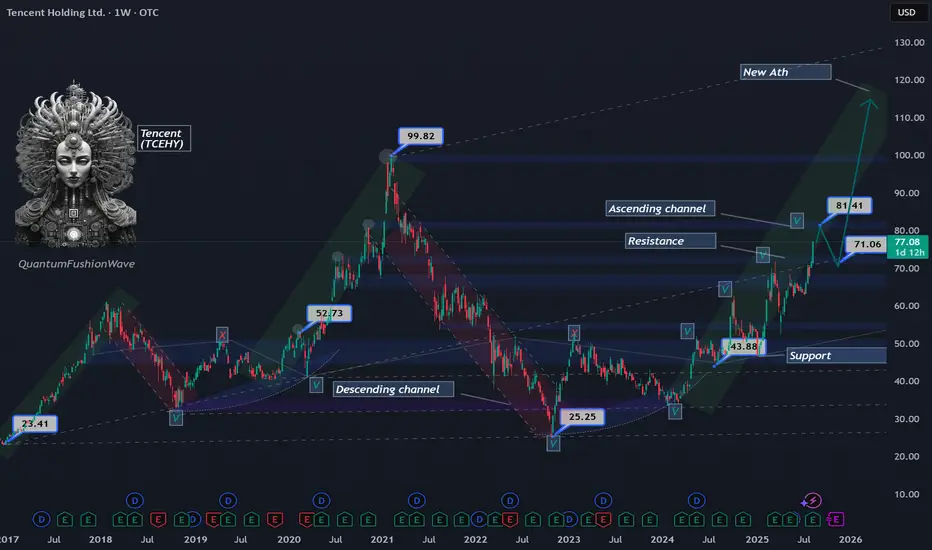
Tencent Holdings Ltd. (TCEHY) is trading around $77 and approaching a critical resistance zone at $81. A clean breakout above $81 would open the path for price to challenge its previous all-time highs, signaling strong continuation within its bullish structure.
However, $81 also aligns with a key historical resistance from November 2020, making it a level to watch for potential rejection. If price fails to break through, a retracement toward the $71 support zone could unfold, providing a healthy reset within the broader uptrend.
Should the $71 area hold as support and buying momentum resume, Tencent could mount a rally toward the $100 mark, reinforcing its longer-term bullish channel.
Key levels to watch:
Resistance: $81 (critical breakout level)
Support: $71 (retracement target)
Upside target: $100 if bullish momentum continues
Disclaimer
The information and publications are not meant to be, and do not constitute, financial, investment, trading, or other types of advice or recommendations supplied or endorsed by TradingView. Read more in the Terms of Use.
Disclaimer
The information and publications are not meant to be, and do not constitute, financial, investment, trading, or other types of advice or recommendations supplied or endorsed by TradingView. Read more in the Terms of Use.