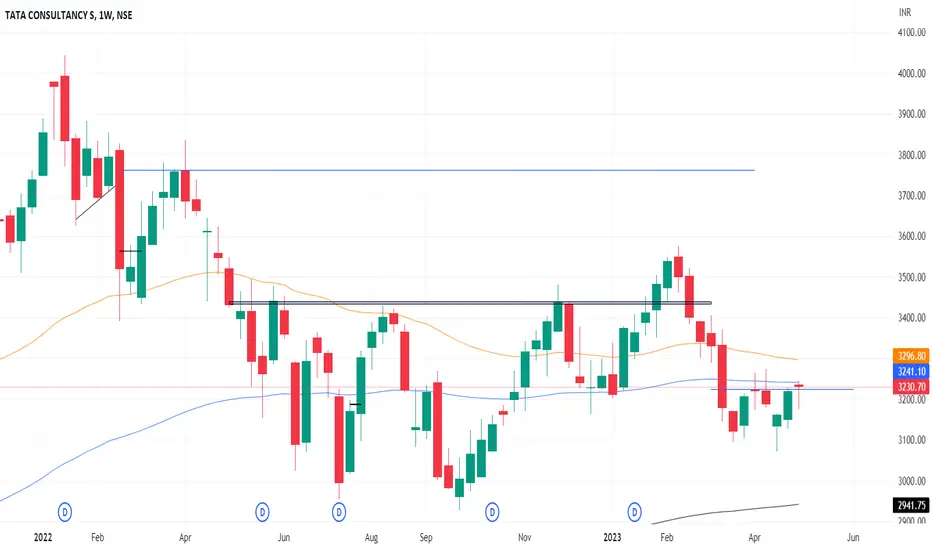
In the Weekly Chart of TCS ,
we can see that, it has a recovery in W pattern.
Bullish Candle is foamed on support.
Enter on breaking its high with Low as SL and Go very Long.
we can see that, it has a recovery in W pattern.
Bullish Candle is foamed on support.
Enter on breaking its high with Low as SL and Go very Long.
Disclaimer
The information and publications are not meant to be, and do not constitute, financial, investment, trading, or other types of advice or recommendations supplied or endorsed by TradingView. Read more in the Terms of Use.
Disclaimer
The information and publications are not meant to be, and do not constitute, financial, investment, trading, or other types of advice or recommendations supplied or endorsed by TradingView. Read more in the Terms of Use.