Price Action History:
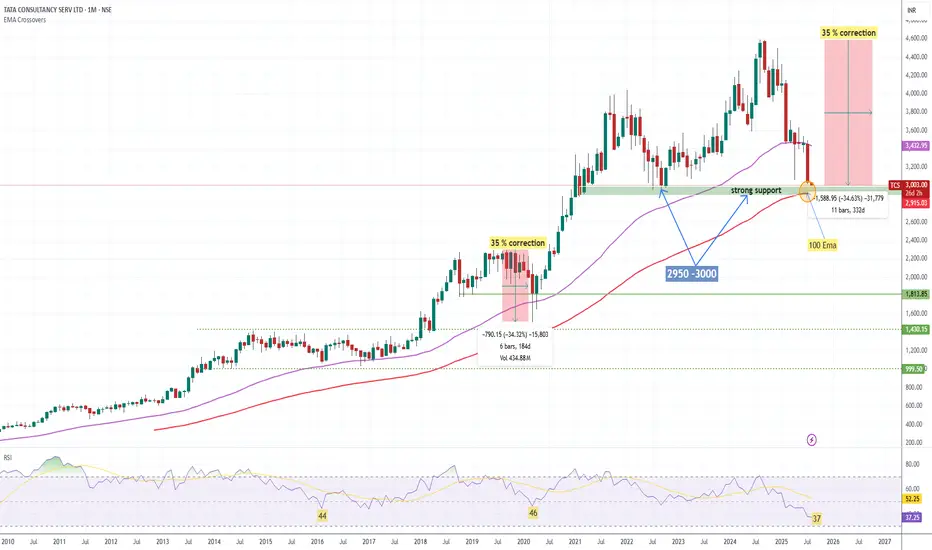
During the COVID crash, TCS fell nearly 35% from its top, eventually taking support at the 100 EMA on the monthly chart and staging a strong bounce.
In 2022 (June,july,Sep,Oct), around 3000 zone was tested multiple times, followed by a significant rally.
📊 Current Scenario:
Once again, TCS is trading near the ₹2950–₹3000 zone, which coincides with the 100-month EMA – a historically proven support level.
Price action suggests we are at a critical inflection point similar to past major bottoms.
✅ Key Technical Levels:
Support Zone: ₹2950–₹3000 (100 EMA Monthly+ 2022 support level)
Immediate Resistance: ₹3300–₹3400
Upside Potential: A bounce similar to COVID & 2022 patterns could trigger a strong upside move.
Trading Strategy:
if you are short term trader Keep a strict stop-loss below ₹2900 (monthly close basis) or 100 monthly EMA
Position sizing is key – don’t over-leverage.
🔎 Conclusion:
For long term trader This zone has historically acted as a strong accumulation area for long-term investors. If history repeats, this could be a high probability buying opportunity for swing and positional traders.
Fundamental Factor
Net Profit (Q1 FY26) ₹12,760 cr (+6% YoY)
Revenue Growth +1.3% YoY (−3.1% in CC)
Operating Margin 24.5% (↑30 bps QoQ)
Trailing P/E 22× (vs 5‑yr average ~24‑26×)
Dividend Yield 2.0%
ROE /ROCE 52%/64%
Disclaimer
The information and publications are not meant to be, and do not constitute, financial, investment, trading, or other types of advice or recommendations supplied or endorsed by TradingView. Read more in the Terms of Use.
Disclaimer
The information and publications are not meant to be, and do not constitute, financial, investment, trading, or other types of advice or recommendations supplied or endorsed by TradingView. Read more in the Terms of Use.