Tata Consultancy Services (TCS), a leading player in the IT services sector, has recently garnered attention for its potential volume increase, making it a focal point for technical analysis.
This blog post delves into the current technical trend analysis of TCS stock (NSE: TCS) based on the 1-day chart.
Selection Rationale
TCS was selected for this analysis due to its observed potential for increased trading volume, a critical indicator of market interest and price movement. The analysis employs a trendline drawn from the highest highs to capture the stock's directional momentum, complemented by Fibonacci retracement levels to identify key support and resistance zones.
Trendline and Fibonacci Analysis
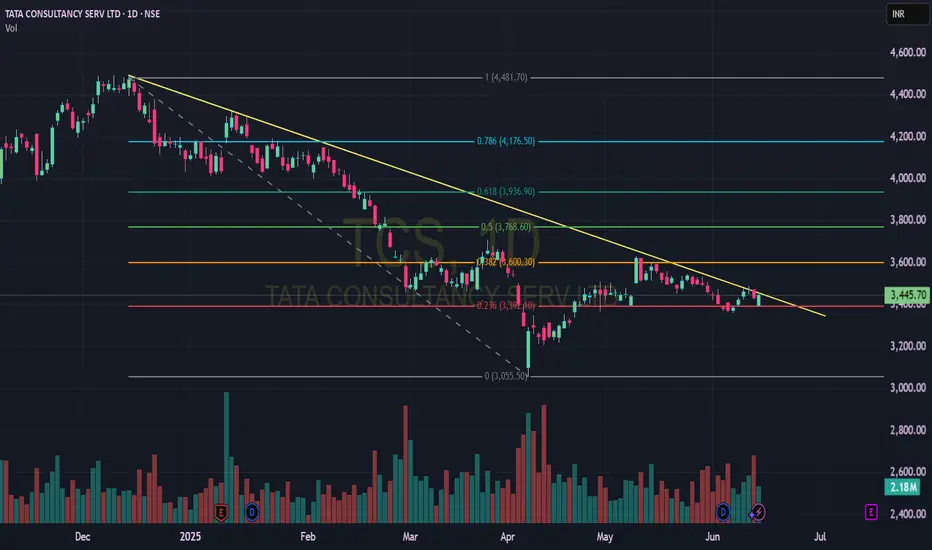
The primary trendline, established from the peak highs, indicates a downward trajectory over the observed period. This suggests a bearish sentiment prevailing in the short term. Overlaying the Fibonacci retracement tool, the price action reveals significant support at the 0.236 level, currently aligning around INR 3,445.70. This level has historically acted as a strong support zone, where the stock price has demonstrated resilience against further declines.
Key Support and Resistance Levels
Resistance Levels: The chart highlights resistance at INR 3,660.00 (0.5 Fibonacci level), INR 3,936.90 (0.618 level), and INR 4,176.50 (0.786 level), with the upper bound nearing INR 4,600.00.
Support Levels: Beyond the current support at INR 3,445.70, additional support is noted at INR 3,200.00, with a potential downside to INR 3,055.50 if the trend continues.
Volume Insights
The volume bars at the bottom of the chart reflect intermittent spikes, particularly around key price movements. This corroborates the selection criterion of potential volume increase, suggesting that significant buying or selling pressure could influence future price action.
Conclusion
The technical analysis of TCS indicates a bearish trendline with the stock currently testing a critical Fibonacci support level at 0.236 (INR 3,445.70). Investors and traders should monitor this level closely, as a break below could signal further downside, while a rebound may indicate a reversal or consolidation. Given the potential for volume-driven movements, staying attuned to market developments will be essential for informed decision-making.
For a more comprehensive analysis or real-time updates, consider utilizing advanced tools and platforms like TradingView, and consult with a financial advisor for personalized investment strategies.
Disclaimer: This analysis is for educational purposes only and should not be considered financial advice. Always conduct your own research and consult with a professional before making investment decisions.
This blog post delves into the current technical trend analysis of TCS stock (NSE: TCS) based on the 1-day chart.
Selection Rationale
TCS was selected for this analysis due to its observed potential for increased trading volume, a critical indicator of market interest and price movement. The analysis employs a trendline drawn from the highest highs to capture the stock's directional momentum, complemented by Fibonacci retracement levels to identify key support and resistance zones.
Trendline and Fibonacci Analysis
The primary trendline, established from the peak highs, indicates a downward trajectory over the observed period. This suggests a bearish sentiment prevailing in the short term. Overlaying the Fibonacci retracement tool, the price action reveals significant support at the 0.236 level, currently aligning around INR 3,445.70. This level has historically acted as a strong support zone, where the stock price has demonstrated resilience against further declines.
Key Support and Resistance Levels
Resistance Levels: The chart highlights resistance at INR 3,660.00 (0.5 Fibonacci level), INR 3,936.90 (0.618 level), and INR 4,176.50 (0.786 level), with the upper bound nearing INR 4,600.00.
Support Levels: Beyond the current support at INR 3,445.70, additional support is noted at INR 3,200.00, with a potential downside to INR 3,055.50 if the trend continues.
Volume Insights
The volume bars at the bottom of the chart reflect intermittent spikes, particularly around key price movements. This corroborates the selection criterion of potential volume increase, suggesting that significant buying or selling pressure could influence future price action.
Conclusion
The technical analysis of TCS indicates a bearish trendline with the stock currently testing a critical Fibonacci support level at 0.236 (INR 3,445.70). Investors and traders should monitor this level closely, as a break below could signal further downside, while a rebound may indicate a reversal or consolidation. Given the potential for volume-driven movements, staying attuned to market developments will be essential for informed decision-making.
For a more comprehensive analysis or real-time updates, consider utilizing advanced tools and platforms like TradingView, and consult with a financial advisor for personalized investment strategies.
Disclaimer: This analysis is for educational purposes only and should not be considered financial advice. Always conduct your own research and consult with a professional before making investment decisions.
Disclaimer
The information and publications are not meant to be, and do not constitute, financial, investment, trading, or other types of advice or recommendations supplied or endorsed by TradingView. Read more in the Terms of Use.
Disclaimer
The information and publications are not meant to be, and do not constitute, financial, investment, trading, or other types of advice or recommendations supplied or endorsed by TradingView. Read more in the Terms of Use.