Long
TCT/USDT (bullish breakout: up to 50%?)
TCT/USDT
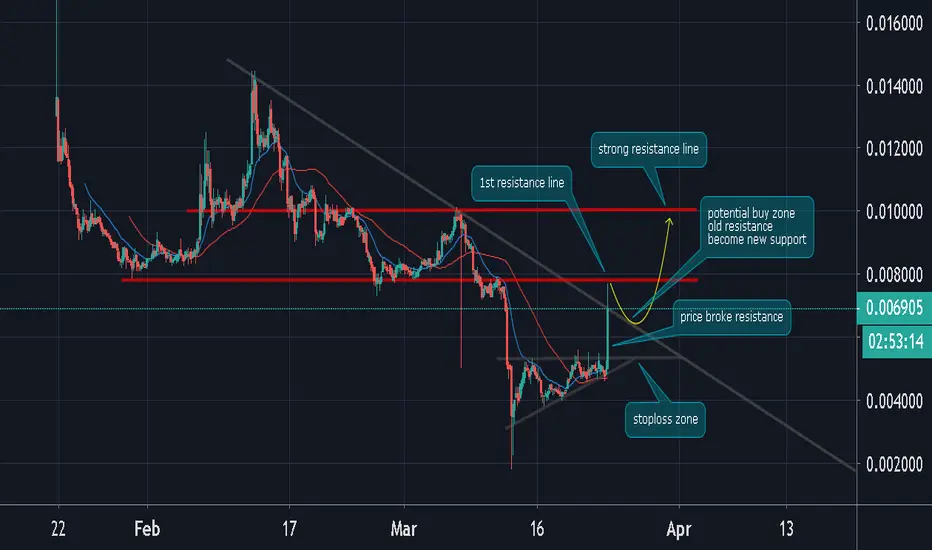
TCT broke bullish of the small ascending triangle and the price quickly touched the 1st trendline resistance zone.
If we see a minor pullback on TCT the trendline support area is where likely the bulls might re-enter the market
to potentially push the price higher until it hits the strong resistance area at 0.01 level.
Bearish side, if the TCT close below 0.0053, short term bullish case will be invalidated.
Disclaimer
The information and publications are not meant to be, and do not constitute, financial, investment, trading, or other types of advice or recommendations supplied or endorsed by TradingView. Read more in the Terms of Use.
Disclaimer
The information and publications are not meant to be, and do not constitute, financial, investment, trading, or other types of advice or recommendations supplied or endorsed by TradingView. Read more in the Terms of Use.