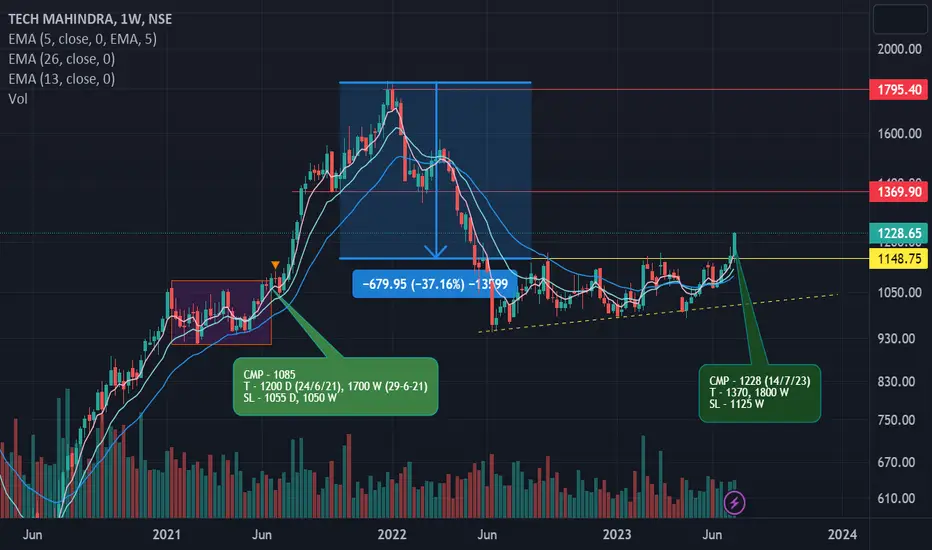
Tech Mahindra has formed head and shoulders and given breakdown somewhere in April. Since then the stock is in down trend and corrected around 48% since its all time high. In last few months, however, it has successfully done consolidation and make a bullish wedge trend reversal. It came to my attention last week, however, the breakout was not looking sustainable. This week it has confirmed then breakout, hence, I am recommending it for medium to long term investment. Now we can expect the up trend and eventually it should test it's all time high again.
The CNX IT index gained whooping 4% or 1300 points in today itself so I am very much positive on the whole IT stocks. An Investor should keep a deep stoploss of 1000 as the company has a reputed management.
CMP - 1228 (14/7/23)
T - 1370, 1800 W
SL - 1125 W
The CNX IT index gained whooping 4% or 1300 points in today itself so I am very much positive on the whole IT stocks. An Investor should keep a deep stoploss of 1000 as the company has a reputed management.
CMP - 1228 (14/7/23)
T - 1370, 1800 W
SL - 1125 W
Disclaimer
The information and publications are not meant to be, and do not constitute, financial, investment, trading, or other types of advice or recommendations supplied or endorsed by TradingView. Read more in the Terms of Use.
Disclaimer
The information and publications are not meant to be, and do not constitute, financial, investment, trading, or other types of advice or recommendations supplied or endorsed by TradingView. Read more in the Terms of Use.