THETA
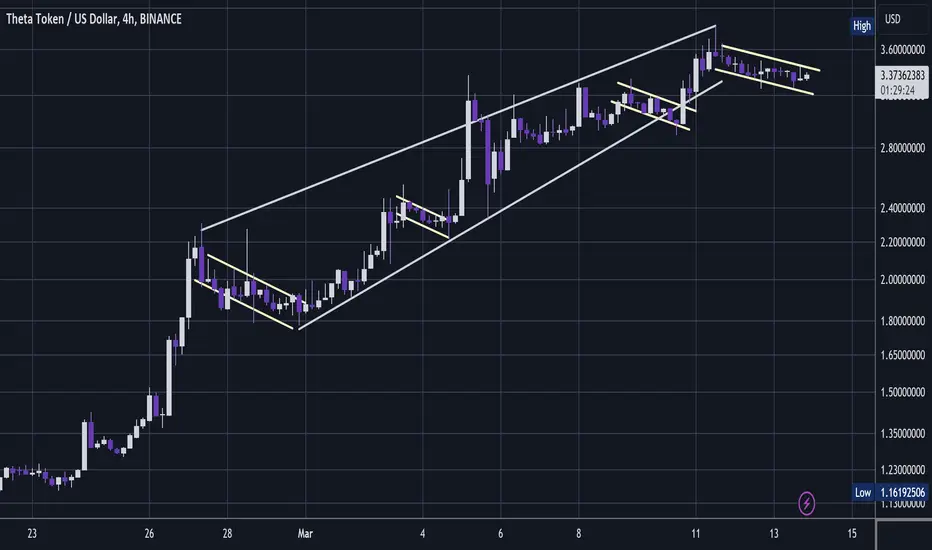
Appears to be copying Bitcoin somewhat in that it has become "corrective" but yet as part of a steady uptrend.
We could look at this as an ascending wedge which is typically known as a bearish pattern.
The textbook will say how the wedge signals weakness to the upside and is typically followed with a break to the downside which is the assertion of the dominant trend.
However the textbooks do not cover crypto and I think we are seeing an interesting anomaly.
And that is that; in ultra bullish phases, the corrections trend up and thus we have bullish ascending channels.
The clue I think is the many lower time frame descending channels within the ascending wedge.
They are bullish patterns.
And the current descending channel is very shallow.
This I think signals that there will be a pump in the pipeline soon enough.
So rather than the textbook; impulsive waves being punctuated by corrective pull backs, what we get instead is ultra impulsive waves punctuated by somewhat slower; steady uptrend.
In the end I think the best way to look at it is that there are multiple tiers of impulse and correction wave.
It doesn't mean that this can't develop into a pull back, but I dont think the ascending wedge is a bearish clue here.
And this may continue on up without much or any pull back at all 🧐.
Day chart:
Your FA guru can't read a chart💭
I run a technical group with lots of content every day + regular videos, 1:1, chatroom 🚀.
Better than all the rest? My record speaks for itself 💡.
Telegram Group: $50 per month✨.
Contact: t.me/dRends35
I run a technical group with lots of content every day + regular videos, 1:1, chatroom 🚀.
Better than all the rest? My record speaks for itself 💡.
Telegram Group: $50 per month✨.
Contact: t.me/dRends35
Related publications
Disclaimer
The information and publications are not meant to be, and do not constitute, financial, investment, trading, or other types of advice or recommendations supplied or endorsed by TradingView. Read more in the Terms of Use.